Tropical Cyclone Analytics#
Based on STORM v4 (2023) hazard data as max wind speed (m/s) by Return Period scenario.
Exposure by hazard thresholds on population, built-up and agricultural area
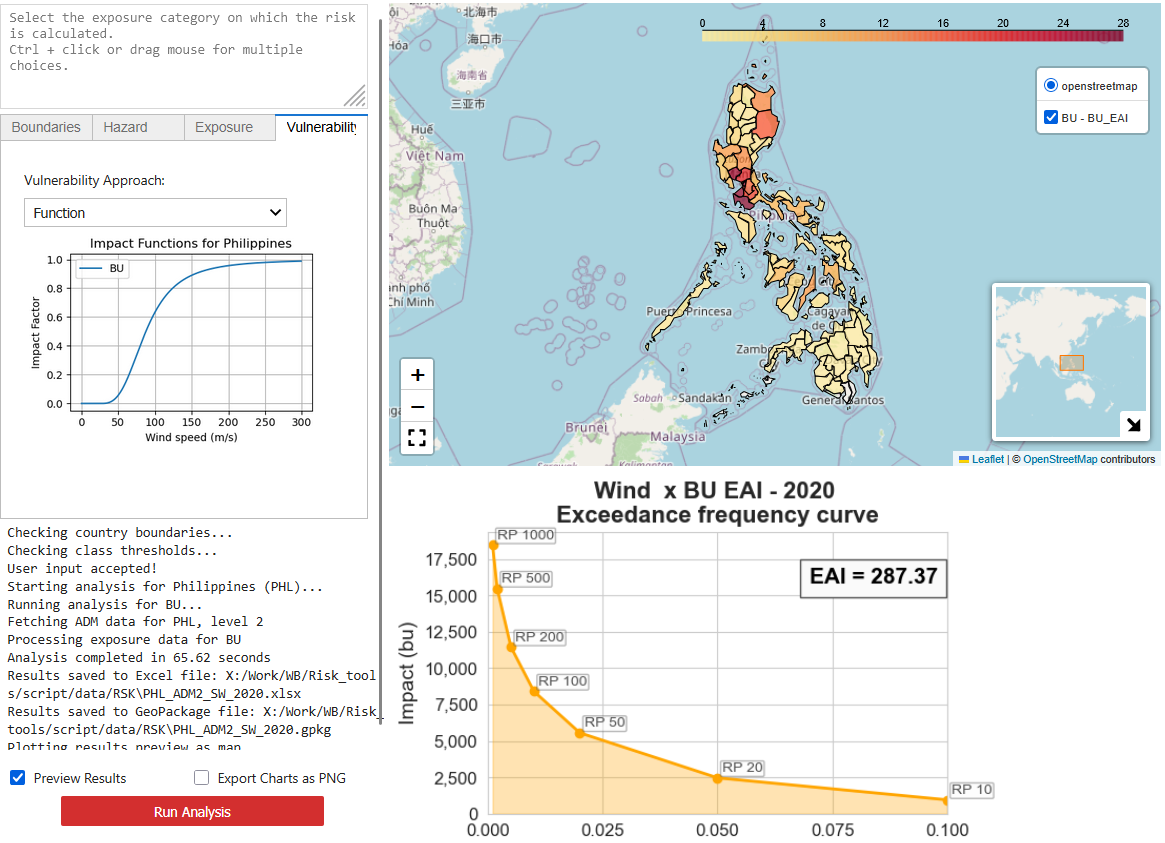
2. Expected Annual Impact estimates on built-up area using regional-specific damage curves from CLIMADA.
Input data management#
The script fetches default data automatically. This includes:
National and sub-national boundaries from the WB ArcGIS repository.
Population data from WorldPop
Built-up data from WSF 2019
Land-cover (agriculture) data from ESA WorldCover
Default exposure datasets can be overridden by placing custom datasets in the EXP folder and pointing at those file in the interface.
The STORM v4 global dataset is available for download.
Set the folders as:
Work dir/
 - GUI.ipynb		Place the notebooks and related files in the main work directory
 - common.py
 - ...
 - Data/
   - HZD/GLB/STORM/2020	  	                  Hazard layers (baseline)
   - HZD/GLB/STORM/2050	  	                  Hazard layers (future)
   - EXP/		                                  Exposure layers
   - RSK/		                                  Output directory
Running the analysis#
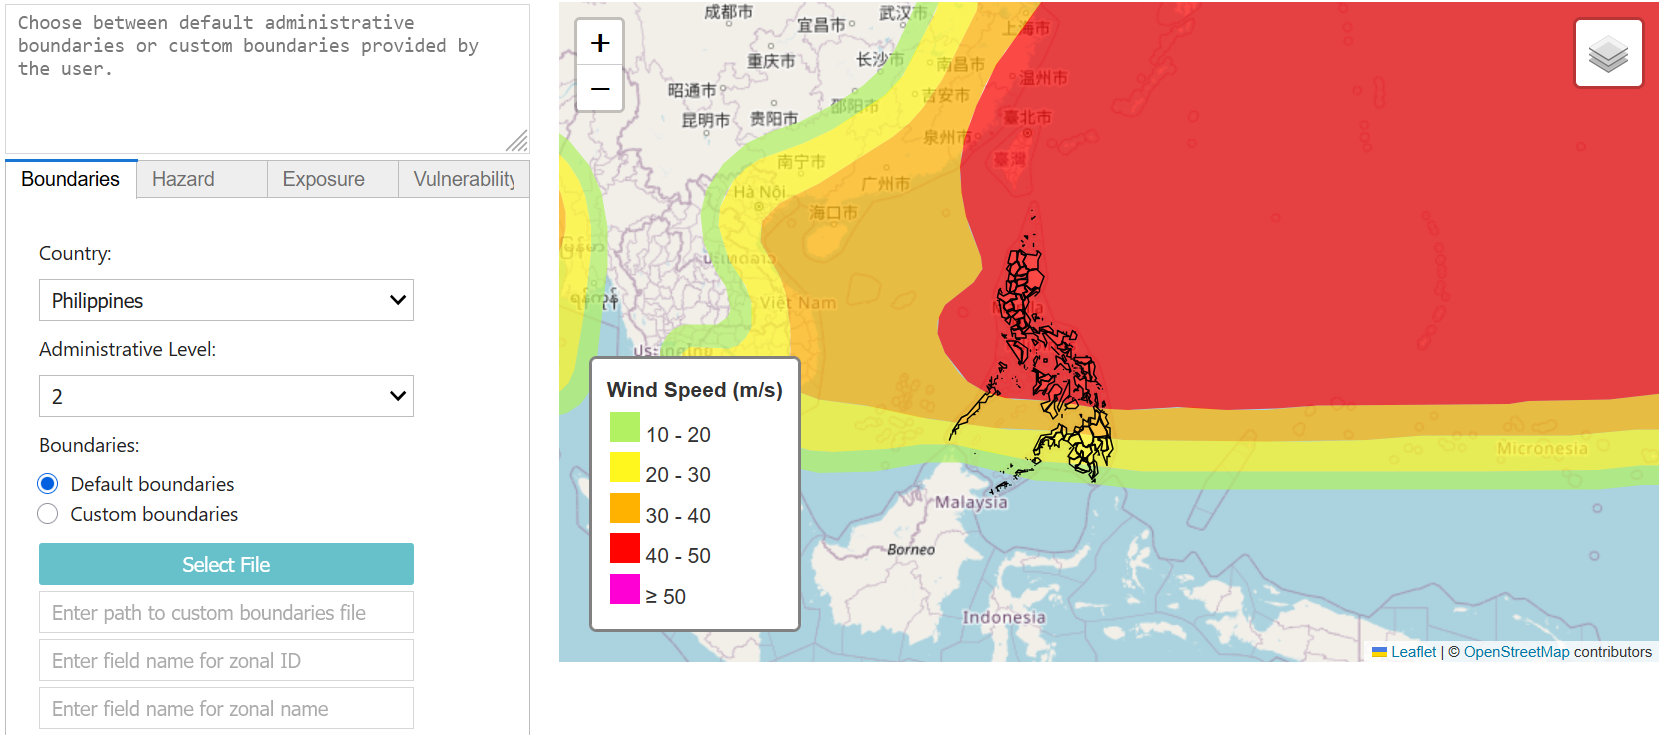
Select the country first. The country must be located within the hazard extent (tropics) for the analysis to start. Sub-national boundaries for level 1 and 2 can be fetched automatically. Else, you can load custom boundaries as geopackage (WGS 84). You will need to specify the field to be used to run zonal statistics, and related label name (e.g. ADM3_PCODE and ADM3_EN).
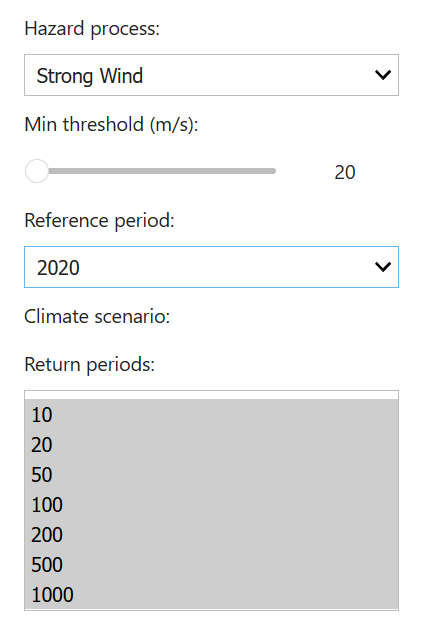
Move to Hazard tab: select the hazard process, the minimum hazard intensity threshold, the time period and climate scenario. Select one or more Return Periods (CTRL+Click / drag mouse).
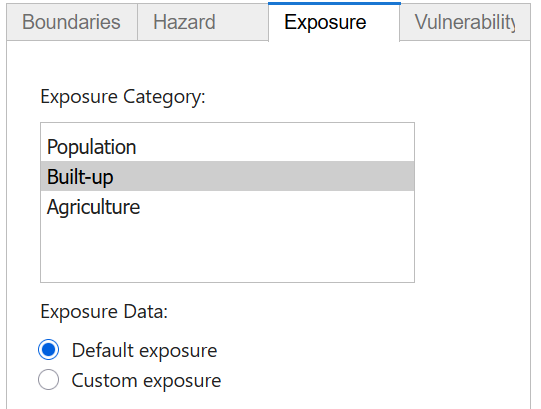
Select one or more Exposure categories (CTRL+Click / drag mouse). You can select a custom exposure layer for each selected category (.tif raster, WGS 84).
Select the approach to use for the analysis:
When using “function”, the best impact function is selected for the selected country. Only built-up damage functions are available for wind impact.
When using “classes”, hazard intensity thresholds must be specified by the user.
Check “Preview results” to generate map and charts output in the GUI.