Risk and poverty#
The distributional impact of climate risks can be examined by overlaying risk maps (EAI or EAE) with poverty maps. The combination can be displayed using bivariate maps that show the locations where risk is most likely to translate into most severe impacts on the poorest and vulnerable households.
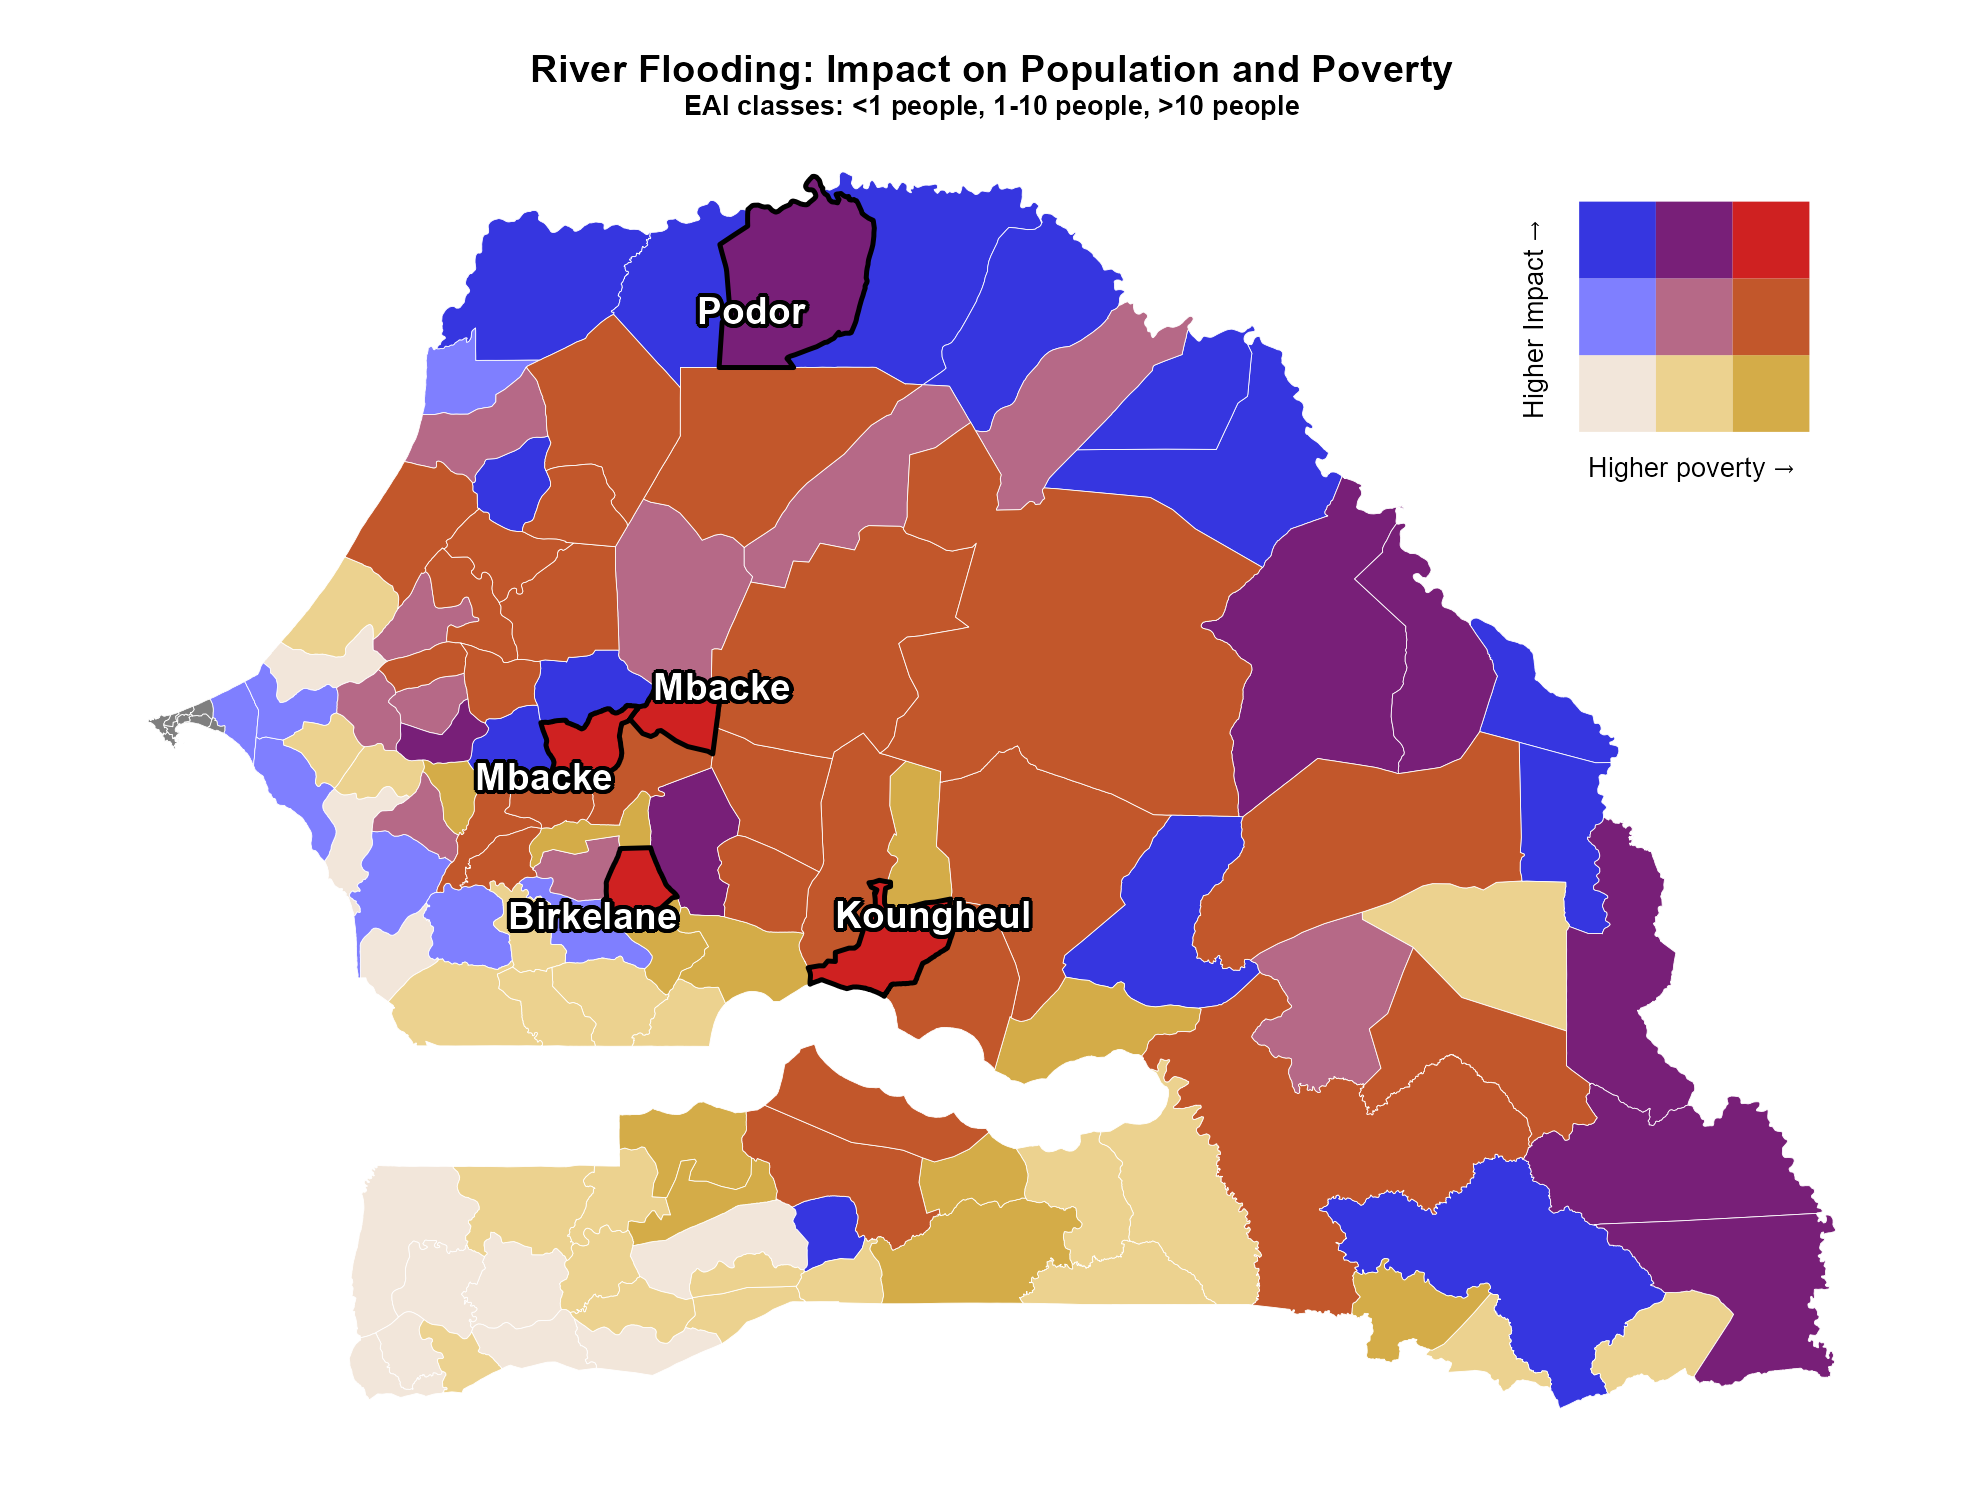
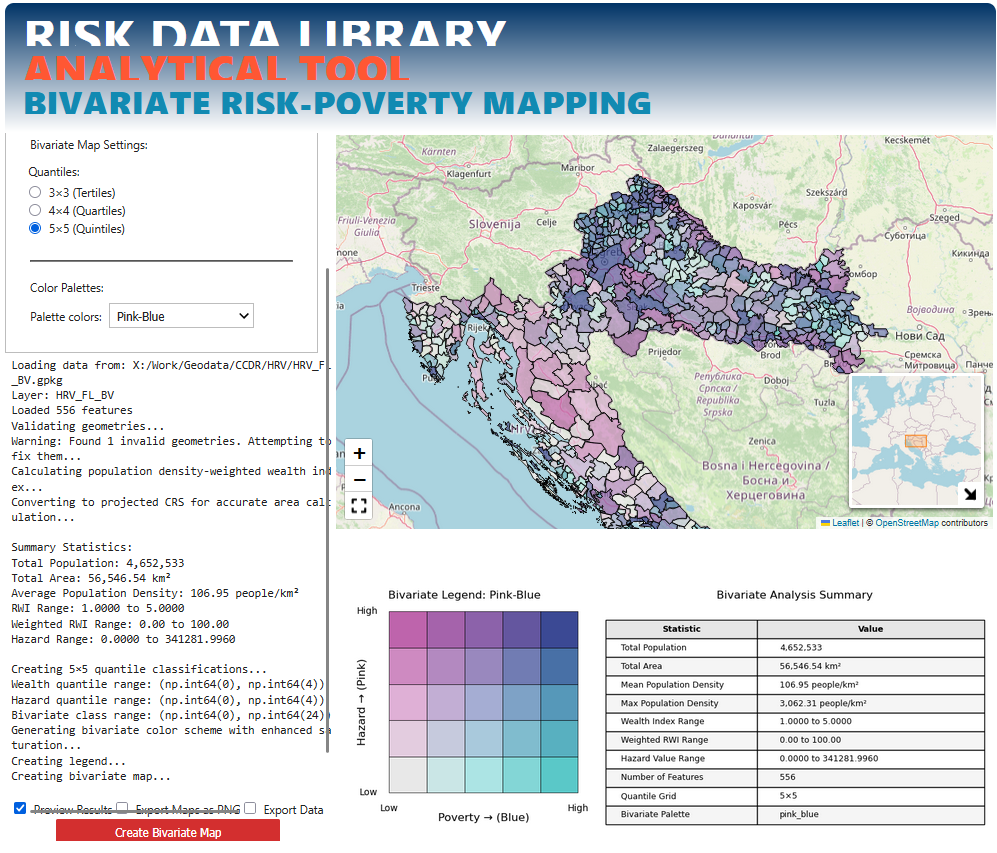
Fig. 28 Example of bivariate maps relating expected annual impact from river floods on population mortality and population socio-economci status as described by population-weighted wealth index (RWI).#
Wealth indices#
The estimate of poverty distribution is usually done measuring either the income distribution (of the household’s dwellers), or expenditure (average monthly expenditure of the household). However, due to the difficulties in obtaining reliable income/consumption data in low- and middle-income countries, alternative ways to build the wealth index are often the best available approximation of relative socio-economic status.
The presence of physical assets in the household can be used to construct a wealth index (Filmer and Pritchett 2001). Relative wealth indices are an equally valid, but distinct measure of household socio-economic status from income and consumption measures (Poirier et al. 2019). Context-specific factors such as country development level may affect the concordance of health and educational outcomes with wealth indices and urban–rural disparities can be more pronounced using wealth indices compared to income or consumption.
Caution
While the wealth quintiles are useful to understand relative wealth and equity within a country, they do not give one a sense of absolute wealth and neither comply with a predefined mathematical relationship; for instance, a tile with a wealth index value of 2 is richer than a tile with a value of 0.5, but there is no information on how much richer.
Someone deemed “rich” according to the wealth quintiles in developing countries might still have few resources for out-of-pocket expenditures.
Name |
Source |
Model type |
Scale |
|---|---|---|---|
META |
Wealth index |
National |
|
USAID |
Wealth index |
National |
The USAID Demographic Health Survey (DHS) has been used to this purpose, analysing the quantiles distribution obtained from a series of questions about household construction materials, water and sanitation access, and ownership of various items (e.g. television, refrigerator), which form a relative indicator of socio-economic status within a given country at the time of the survey.
AI-based indices such as the Relative Wealth Index (RWI) (Chi et al. 2022) are appealing due to the immediate and cost-effective estimates they can provide. The RWI is an index estimated by a machine learning model for 135 low and middle-income countries to provide micro-estimates (projections) of wealth and poverty at fine-grained 2.4 km resolution tiles. The model is trained on vast and heterogeneous datasets from satellites, mobile phone networks, topographic maps, as well as connectivity data from Facebook. The approach for creating the RWI map overcomes essential limitations of the traditional surveys, such as fine-grained coverage, and timely and cost-efficient data, while extending to countries where DHS does not operate. However, the application of RWI index to a real-world scenario would be sensitive to the socioeconomic particularities of the country, leading to significantly different estimates from the ones obtained by a traditional survey approach.
Index normalisation#
While the DHS index is already population-weighted, the RWI data needs to be weighted using population density to render the survey demographically representative. We provide a simple notebook to quickly perform this operation based on RWI csv data downloaded from HDX and any population raster layer.
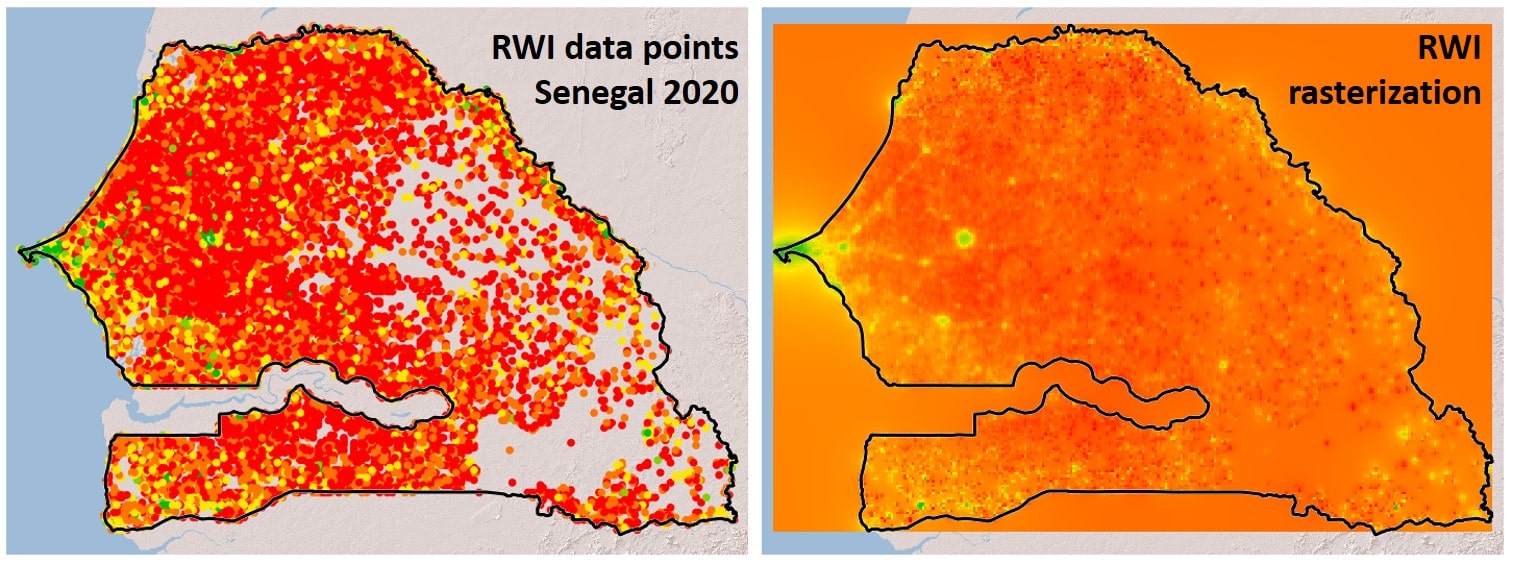
Fig. 29 (left) Original RWI data points (x,y) from Meta; (right) RWI as regular grid (2.4 km).#
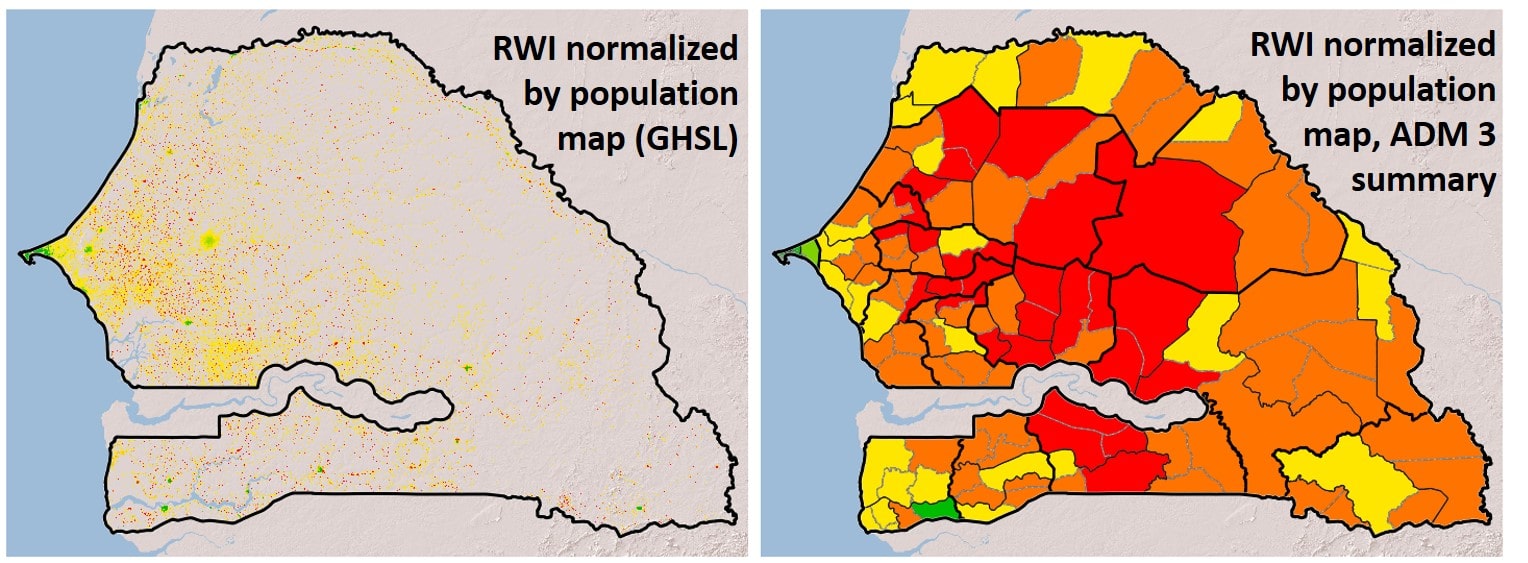
Fig. 30 (left) RWI weighted by population at 100 m (GHSL); (right) Population-weighted RWI summarised at ADM 3 level.#
See also
See a full tutorial on how to normalise RWI using population and plot it as maps! RWI-Pop weighted tutorial
Bi-variate maps#
Poverty maps are combined with EAE/EAI maps to generate bi-variate maps. These maps provide ranks explained by a 3x3 matrix, resulting in 9 possible scores ranging from low-risk / low-poverty to high-risk / high poverty. The matrix is built by classifying poverty indicators into three quantiles and dividing risk indicators (EAE/EAI) of each hazard type into groups.
Risk indicator |
Unit |
Metric |
Risk Classification |
||
|---|---|---|---|---|---|
Low |
Medium |
High |
|||
Flood x Population |
EAI [#] |
Total count |
0.01 - 100 |
100 – 1,000 |
> 1,000 |
Flood x Built-up |
EAI [Ha] |
Total count |
0.01 – 1 |
1 – 10 |
> 10 |
Flood x Agri land |
EAE [Ha] |
Total count |
0.01 - 100 |
100 – 1,000 |
> 1,000 |
Drought x Agri land |
EAE [Ha] |
Ratio |
1% - 5% |
5% - 15% |
> 15% |
Heat stress x Population |
EAE [#] |
Ratio |
1% – 10% |
10% – 30% |
> 30% |
Air pollution x Population |
EAE [#] |
Ratio |
1% – 10% |
10% – 30% |
> 30% |
Classification of total exposure on an administrative unit is done both on the basis of absolute numbers or ratios. For instance, as severe fluvial flooding and landslides represent very localized threats, the classification is based on total counts. In comparison, heat waves, droughts and air pollution are more widespread across geographic units and therefore classified into groups based on proportions.
We offer a python script for creating Bivariate Maps starting from risk and poverty data. Please refer to the main codebase installation.