Climate change and disaster risk#
Climate change can increase disaster risk in a variety of ways:
by altering the frequency, intensity and geographic distribution of weather-related hazards, which may lead to new patterns of risk.
by affecting vulnerability to hazards, and changing exposure patterns.
In other words, disaster risk can be magnified by climate change: it can increase the hazard while at the same time decreasing the resilience of households and communities. Below are some of the main changes expected by the IPCC Sixth Assessment Report.
Storms and flooding: the water cycle will continue to intensify as the planet warms. That includes extreme monsoon rainfall, but also increasing drought, greater melting of mountain glaciers, decreasing snow cover and earlier snowmelt. Annual average precipitation is projected to increase in many areas as the planet warms, particularly in the higher latitudes.
Sea level rise: the population of coastal areas has grown faster than the overall increase in global population; coastal flooding events could threaten assets worth up to 20% of the global GDP by 2100. Low-lying island states could be completely wiped out by sea level rise.
Heat stress: the most direct impact of global warming will be an increase of temperatures, which will aggravate heat stress consequences on human health and agricultural production, in particular in tropical countries with low capacity for adaptation.
Droughts: there will likely be a large reduction in natural land water storage in two-thirds of the world, especially in the Southern Hemisphere. The number of people suffering extreme droughts across the world could double in less than 80 years, which has major implications for the livelihoods of the rural poor, and can also lead to increased migration streams.
Tropical cyclones: even though the attribution of these events to climate change is difficult, a robust increase of the most devastating storms with climate change is expected. Under 2.5°C of global warming, the most devastating storms are projected to occur up to twice as often as today.
Hydro-meteorological hazards are affected by climate forcing, and, as such, climate change should be accounted when estimating future risk conditions. A forward-looking analysis makes use of climate projections to explore how environmental risks could develop spatially over time.
Climate indices#
Climate indices are standardized measurements used to track and summarize complex climate patterns over time. These indices distill vast amounts of climate data, such as temperature, precipitation, and atmospheric pressure, into simpler, more understandable metrics. By providing insights into trends and variations in these phenomena, climate indices assist in predicting weather patterns, understanding climate variability, and informing climate-related decisions across various sectors.
In the context of disaster risk, climate indices play a critical role in understanding and anticipating the impact of climate-related hazards. These indices help assess the likelihood of extreme weather events such as droughts, floods, hurricanes, and heatwaves by tracking patterns in atmospheric and oceanic conditions that influence climate variability. Projected changes of climate indices against baseline (anomalies) can be used to infer changes in natural hazard frequency and intensity.
The Climate Indices tools allow to compute climate indices for the desired sub-national boundary level based on the most updated climate modelling (CMIP6). The table below summarises the relationship between a few climate indices and associated hazards.
Name |
Description |
Related hazard |
|---|---|---|
CWD |
Consecutive Wet Days [days/month] |
Flood, Landslide |
R20mm |
Days with rainfall > 20 mm [days] |
Flood, Landslide |
Rx5day |
Maximum 5-day precipitation [mm] |
Flood, Landslide |
R99p |
Extremely wet day precipitation [days] |
Flood, Landslide |
slr |
Sea Level Rise [m] |
Coastal floods |
CDD |
Consecutive Dry Days [days/month] |
Drought |
SPEI |
Standard Precipitation-EvapoT Index [-] |
Drought |
WBGT/UTCI |
Composite heat index [°C] |
Heat |
tas |
Mean surface temperature [°C] |
Heat |
hi35 |
Days with heat index above 35°C [Days] |
Heat |
Given that specific unit of measurement varies across climate indices, these could be hard to compare and combine. In some cases, it’s useful to express the projected anomalies in terms of % change in relation to historical variability. Data from climate models released under the IPCC Sixth Assessment Report (AR) framework are used to establish estimates of baseline and future projected climate anomalies.
ARs are supported by coordinated climate modeling efforts referred to as Coupled Model Intercomparison Projects (CMIP). Version 6 (CMIP6) underpins the IPCC AR6 (2021–2022) and models future climate through Shared Socioeconomic Pathways (SSPs) — storylines combining greenhouse gas emission trajectories with broader socioeconomic development assumptions. Version 7 (CMIP7), currently being rolled out (2024–), will provide updated Earth System Model projections and is expected to underpin the next IPCC assessment cycle (AR7).
Dimensions of climate indices:#
SSPs: scenarios SSP1/RCP2.6, SSP2/RCP4.5, SSP3/RCP7.0, SSP5/RCP8.5
Models ensemble range: percentiles p10, p50, p90
Period: Historical (1981-2015), [Near term (2020-2039), Medium term (2040-2059), Long term (2060-2079), End of century (2080-2099)]
Time scale: Monthly, Seasonal, Annual
Additional Guidance for aligned scenario selection is provided by the shared CCDR Global Climate Scenarios note.
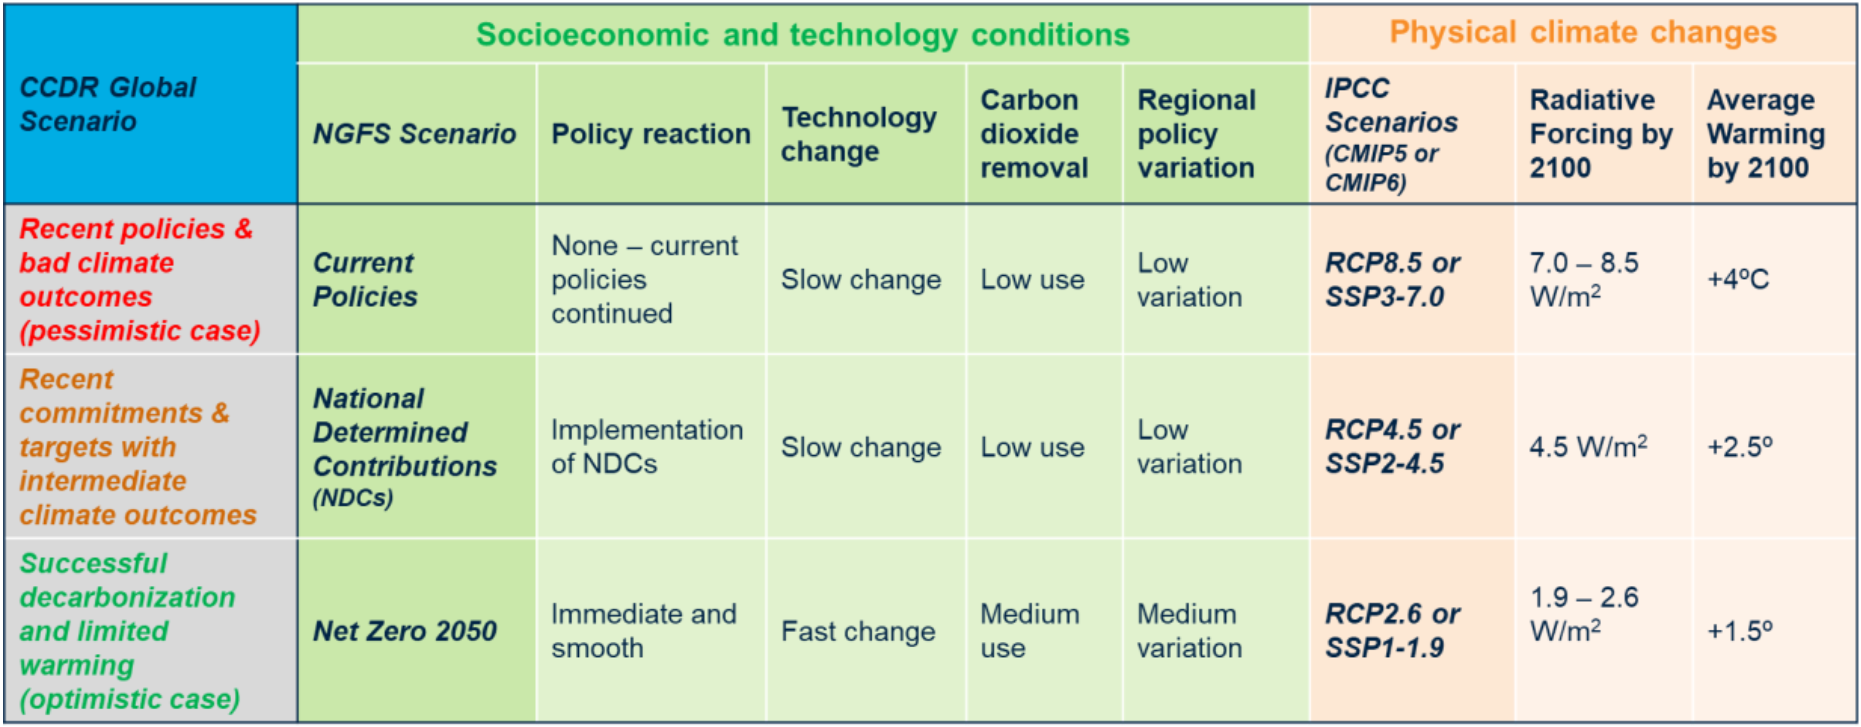
Fig. 10 Recommended CCDR Global Scenarios and characteristics for adaptation and development planning.#
SSP1-2.6 (low emissions): strong mitigation scenario where emissions peak before 2030 and decline rapidly. Projected global mean warming of ~1.8 °C above pre-industrial levels by 2100 (likely range 1.3–2.4 °C, IPCC AR6).
SSP2-4.5 (intermediate): moderate mitigation with emissions stabilizing around current levels then declining after mid-century. Projected warming of ~2.7 °C by 2100 (likely range 2.1–3.5 °C, IPCC AR6).
SSP5-8.5 (high emissions): fossil fuel-intensive development with no significant mitigation; emissions continue rising through 2050. Projected warming of ~4.4 °C by 2100 (likely range 3.3–5.7 °C, IPCC AR6).
Note
On scenario plausibility (CMIP7 update)
Recent emission trend analysis and the emerging CMIP7 ScenarioMIP protocol indicate that the two extreme bookends are no longer considered plausible central planning scenarios:
SSP1-1.9: Requires global net-negative CO₂ emissions well before 2050 at a pace inconsistent with current national policy commitments. While useful as a theoretical 1.5 °C benchmark, it is not a realistic projection.
SSP5-8.5: Assumes a massive, sustained expansion of coal use through 2100 that is inconsistent with current energy transition trends. It is useful as a stress-test upper bound but should not be treated as “business as usual” (Hausfather & Peters, 2020).
Current observed emission trajectories fall within the SSP2-4.5 to SSP3-7.0 range. For risk planning purposes, these two scenarios are the recommended primary reference, with SSP1-2.6 retained as an optimistic lower bound.
Data sources#
The climate indices are primarily sourced from the Climate Change Knowledge Portal by the World Bank, which provides a large selection of climate indices for both trends and extremes, accessible via raster download or API. Additional indices could also be obtained from external sources.
Name |
Developer |
Description |
Data format |
|---|---|---|---|
EU |
Large collection of global variables and indices |
Geodata |
|
GOST |
Full selection of variables, model members, periods |
Geodata |
|
IPCC |
Selection of climate variables for a range of periods and scenario |
Table, geodata, maps, charts |
|
SEDAC |
Global Drought Indices SPI and SPEI for 3, 6 and 12 months covering past and future (1980-2100) at 25 km resolution based on Downscaled CMIP6 Models and SSP-RCP Combinations |
Geodata |