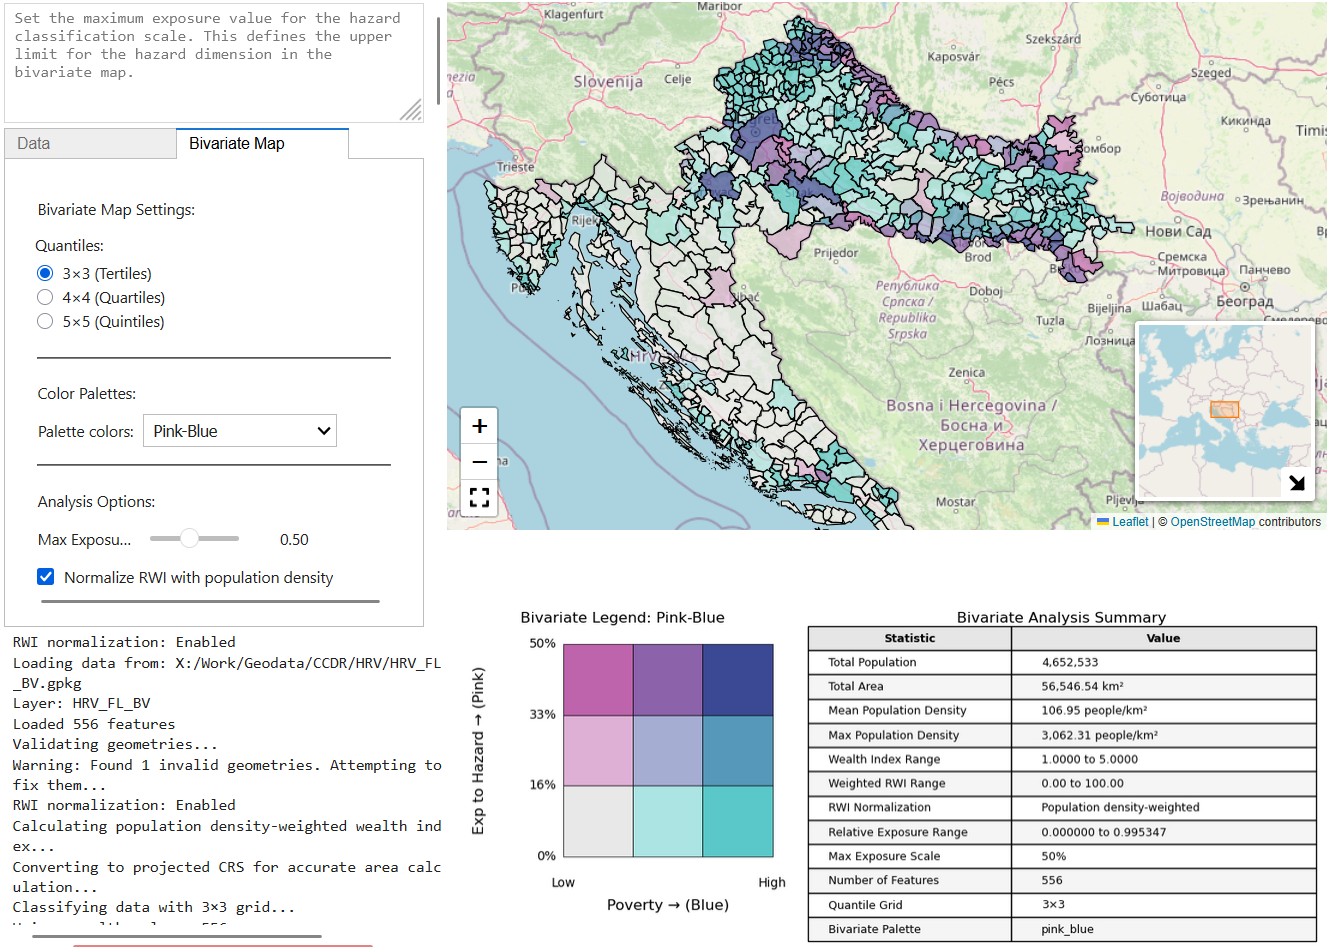
Bivariate mapping of Risk and Poverty#
This tool calculates population-weighted wealth index scores and combines those with hazard index scores into a bivariate choropleth map. The scores are calculated by quantile ranking.
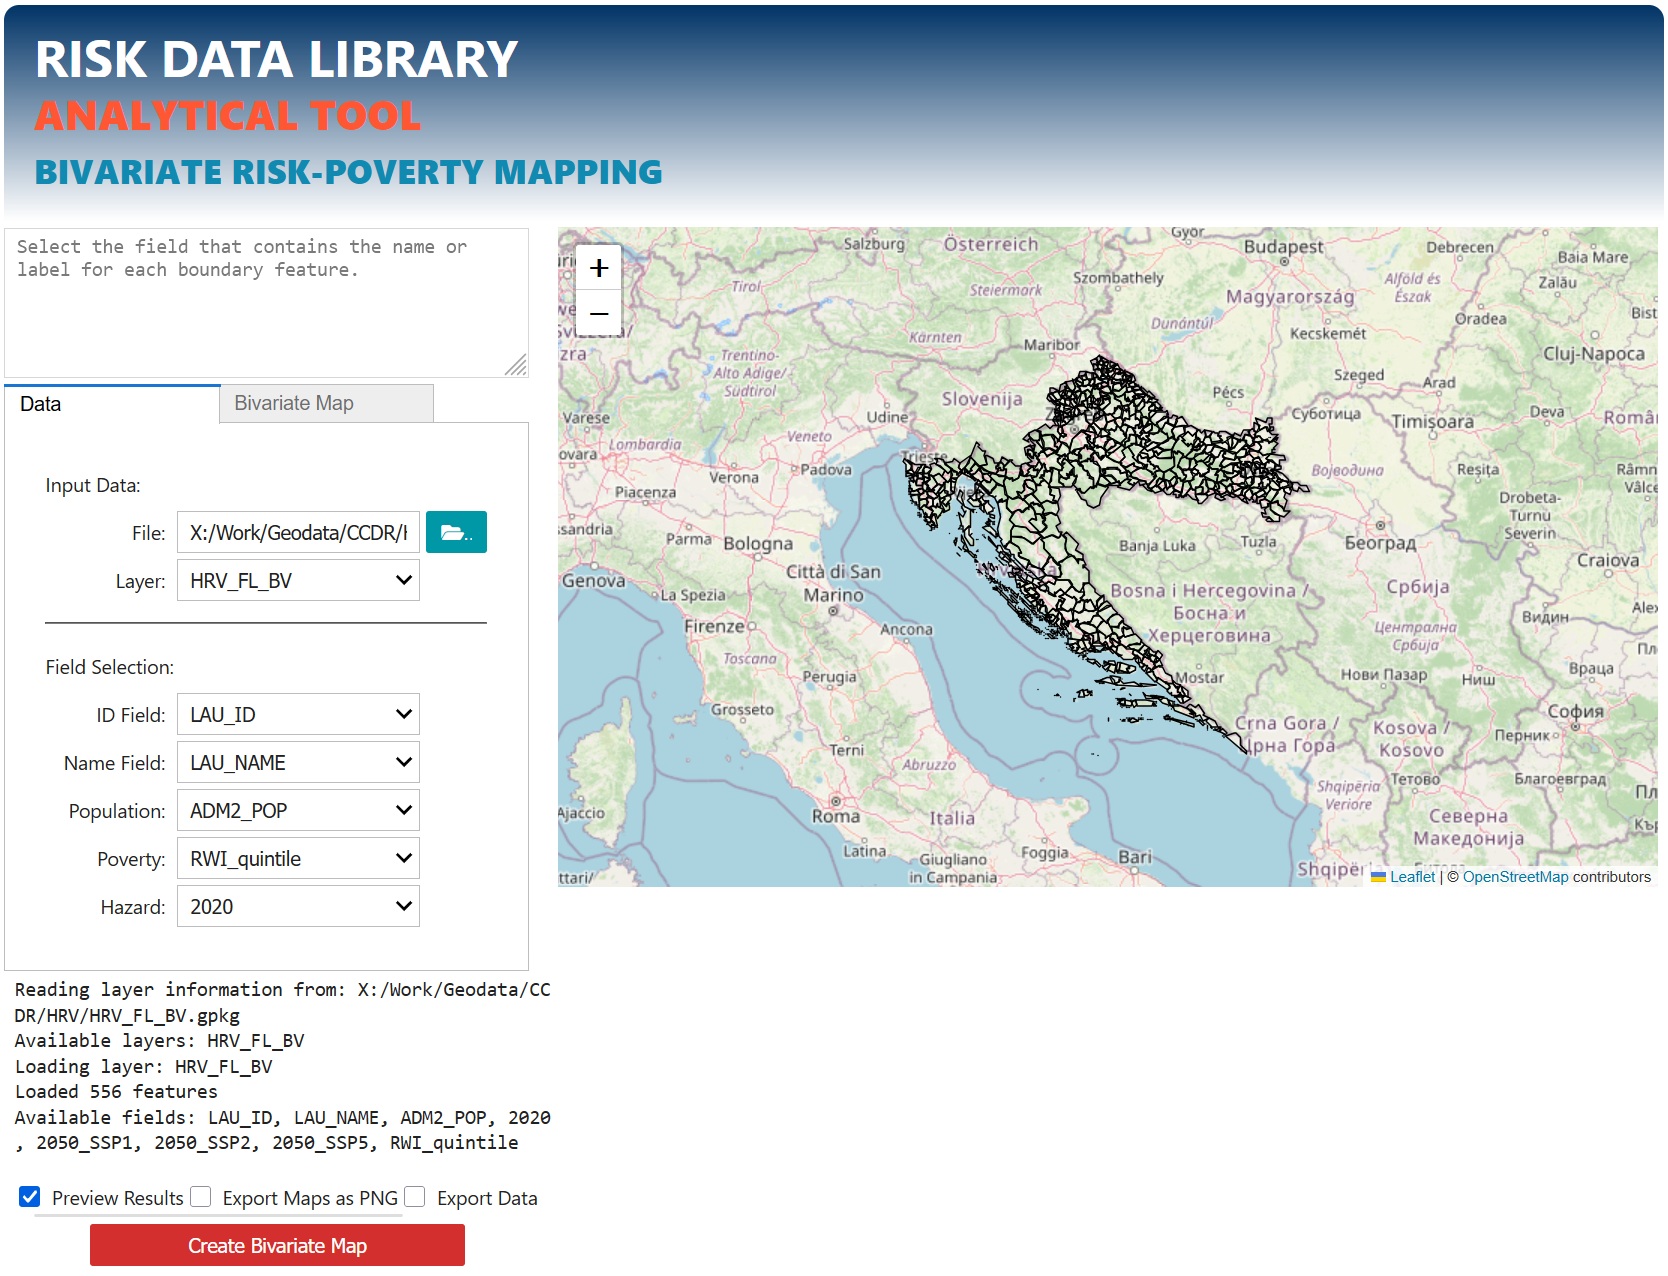
Input data management#
Input data should consist of a GeoPackage file with administrative boundaries containing fields for: Unit ID, Unit NAME, Unit POP, wealth index (e.g. RWI), and hazard score (e.g., EAI).
Running the analysis#
Data tab: select the vector file containing all the required input at boundary level. Select the appropriate field for each attribute - they should be found automatically, but check they are correct.
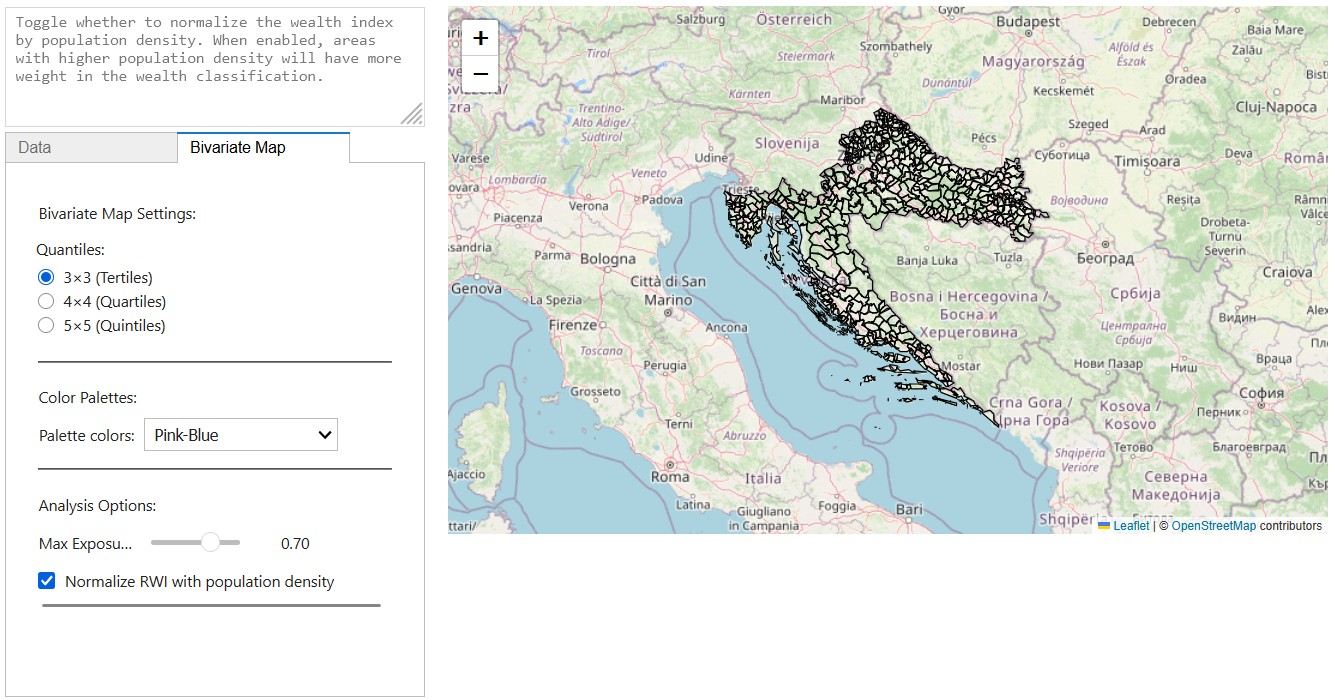
Bivariate tab: select the number of classes to consider for each index, the bivariate color palette and the maximum exposure to hazard threshold (anything above this value will be considered on the top class). Use the normalisation checkbox to normalise the wealth index using population count from the input dataset. This is suggested when using unweighted indices.
Check “Preview results” to generate map and charts output in the GUI, or “Export Maps as PNG” to have those saved in the output folder. “Export data” will create a copy of the input data with added bivariate combination scores.
Click the red button to start the processing.
See also
See Risk and Poverty for an explanation of the bivariate classification matrix, wealth index options, and how to interpret the 3×3 output scores.