Additional resources#
Additional data sources#
Additional sources of risk data (hazard, exposure, disaster losses) and processing workflows.
Name |
License |
Description |
Purpose |
|---|---|---|---|
Open (MS) |
Global environmental geodata as STAC catalog |
Geodata catalog |
|
Varies per dataset |
Global environmental geodata as API catalog |
Geodata catalog |
|
CC-BY-4.0 |
Community-sourced geodata as Earth Engine assets |
Geodata catalog |
|
Open (UNEP) |
Global probabilistic hazard and infrastructure risk layers |
Geodata catalog |
|
Open (WB) |
Global boundaries at the ADM2 level |
Geodata catalog |
|
ODC-By |
Global boundaries for different ADM levels |
Geodata catalog |
The Planetary Computer combines a multi-petabyte STAC catalog of global environmental data with intuitive APIs, a flexible scientific environment that allows users to answer global questions about that data, and applications that put those answers in the hands of researchers and stakeholders.
Note
There is a nice QGIS plugin that allows you to directly get data in the software.
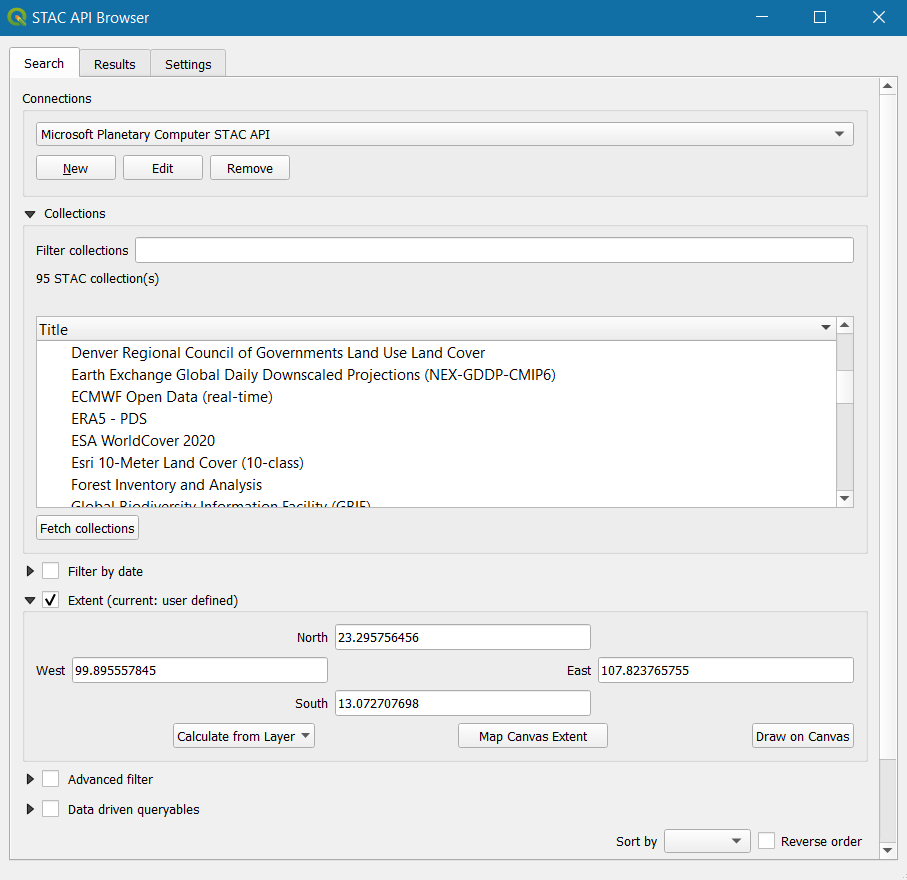
Fig. 35 Planetary Computer as STAC catalogue accessed via QGIS using STAC plugin.#
The Google Earth Engine (GEE) catalog includes a variety of standard Earth science raster datasets. You can import these datasets into your script environment with a single click. You can also upload your own raster data or vector data for private use or sharing in your scripts.
The Awesome GEE community catalog consists of community sourced geospatial datasets made available for use by the larger Google Earth Engine community and shared publicly as Earth Engine assets. The project was started with the idea that a lot of research datasets are often unavailable for direct use and require preprocessing before use. This catalog lives and serves alongside the Google Earth Engine data catalog and also houses datasets that are often requested by the community and under a variety of open license.
The Global Infrastructure Risk Model and Resilience Index (GIRI) Map Viewer is an interactive platform developed by UNEP in collaboration with the Coalition for Disaster Resilient Infrastructure (CDRI). It provides a comprehensive, probabilistic assessment of disaster risks to infrastructure assets worldwide, encompassing both current conditions and future climate scenarios for major natural hazards—including earthquakes, tsunamis, tropical cyclones, floods, landslides, and droughts.
The Map Viewer features over 100 hazard and risk layers, allowing users to explore detailed scenarios and customize analyses. It serves as a vital tool for policymakers, planners, and researchers aiming to develop informed, risk-aware infrastructure policies and investments.
The DECAT Space2Stats program program is designed to provide academics, statisticians, and data scientists with easier access to regularly requested geospatial aggregate data: Official World Bank boundaries at admin level 2 and a global database of hexagons (~36km2).
The Geoboundaries global database is an open-access repository offering detailed, research-ready political administrative boundaries for every country in the world, up to five levels of administrative hierarchy.
External analytical tools#
Name |
License |
Description |
Purpose |
|---|---|---|---|
CC-BY-4.0 |
Methods and workflows as notebooks for Climate Risk Assessments (CRA) based on ECMWF data |
Handbook |
|
Open (IVM-VU) |
Methods and workflows as notebooks for assessing impacts over critical infrastructures |
Handbook |
|
Apache-2.0 |
Methods and workflows as notebooks for geo-mapping |
Handbook |
The CLIMAAX handbook builds upon existing risk assessment frameworks, methods and tools, and promotes the use of datasets and service platforms for local and regional scale deployment. It develops a robust and coordinated framework of consistent, harmonised and comparable risk assessments via python notebooks.
The Critical Infrastructure handbook provides an open-source framework for assessing the risk of critical infrastructure worldwide. By leveraging publicly available datasets and analytical tools, it enables users to evaluate infrastructure exposure, vulnerability, and potential damage due to natural hazards.
The Pythia Foundations is an open-access educational resource developed by the Project Pythia community. It offers comprehensive tutorials and interactive content designed to teach foundational skills in scientific computing with Python, particularly tailored for the geosciences. In particular, it provides in-depth tutorials on key Python libraries like NumPy, Pandas, Matplotlib, Xarray, and Cartopy, which are vital for data analysis and visualization in scientific research.