Natural hazards#
Natural phenomena, whether extreme events or long-term processes, become hazards only when they pose potential harm to people, property, or socioeconomic systems. The occurrence of these natural hazards is primarily determined by physical factors, such as weather system dynamics, tectonic plate movements and terrain characteristics (e.g., slopes, drainage, vegetation). Anthropogenic factors, such as urbanization, environmental degradation and climate change, are known as risk drivers as they can influence the location, frequency, and intensity of natural hazards. The inherently geographical nature of both natural hazards and exposure necessarily requires a geospatial approach to properly understand and interpret the risk. In other words, the spatial dimension is crucial for effective risk assessment and management strategies.
See also
A hazard is a process or phenomenon that may cause loss of life, injury or other health impacts, property damage, social and economic disruption or environmental degradation. Hazards may be natural, anthropogenic or socionatural in origin (UNDRR 2019).
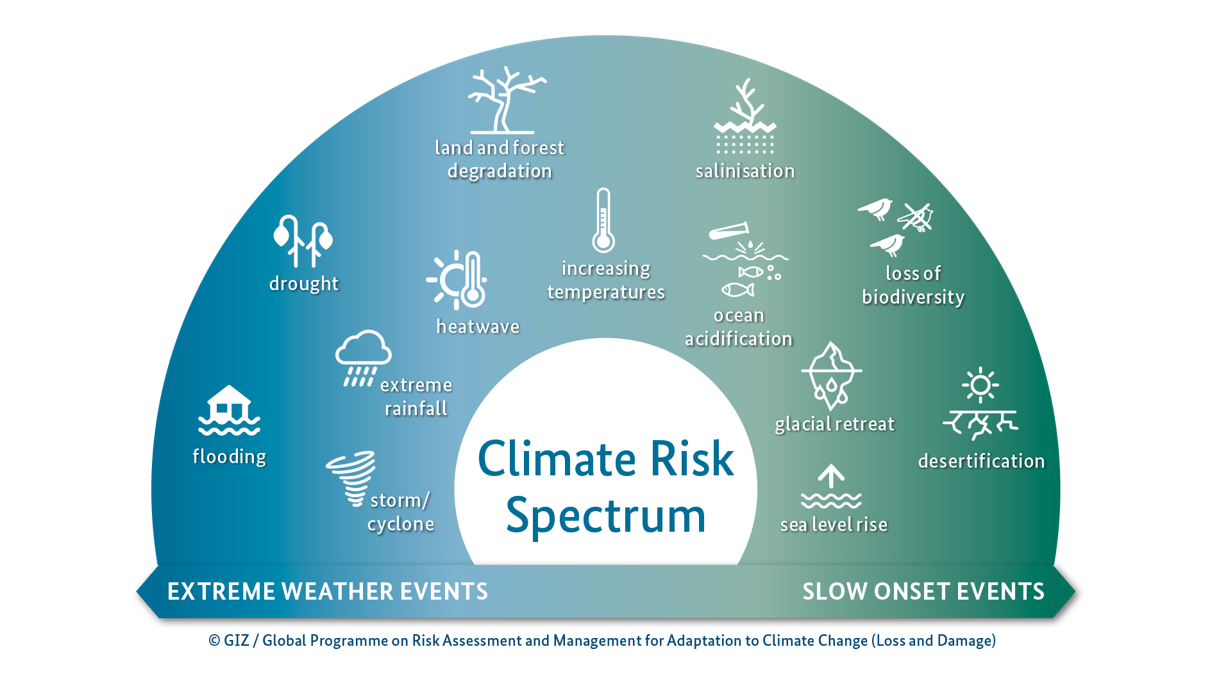
Geophysical Hazards typically include Earthquakes, Tsunami and Volcanic activities.
Hydro-meteorological Hazards include Floods, Landslides, Tropical cyclones, Drought, Heat stress and Wildfires.
While it doesn’t significantly affect geophysical hazards, climate change has the potential to affect the frequency and intensity of hydrometeorological hazards (see climate outlook).
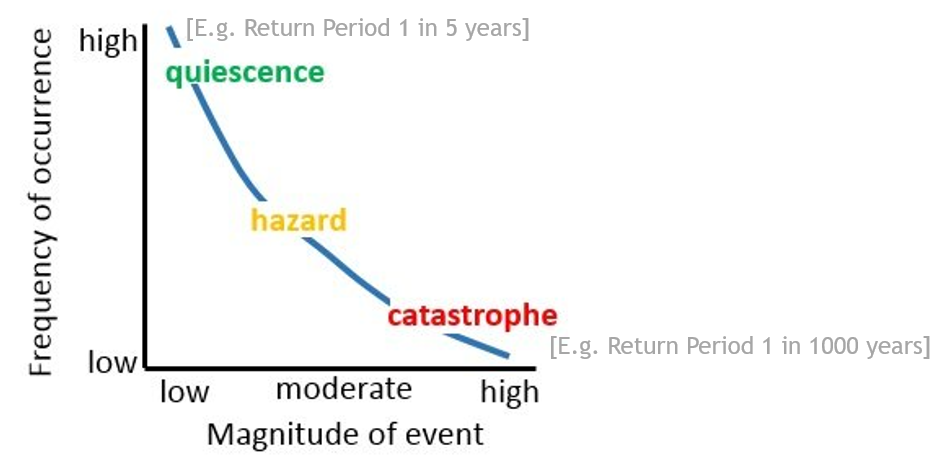
Intensity - frequency relationship#
Hazard intensity is one of the key factors that determine the size of the impact over exposed elements. Hazard data usually come in the form of one or more georeferenced layers representing hazard intensity metric in relation to frequency distribution.
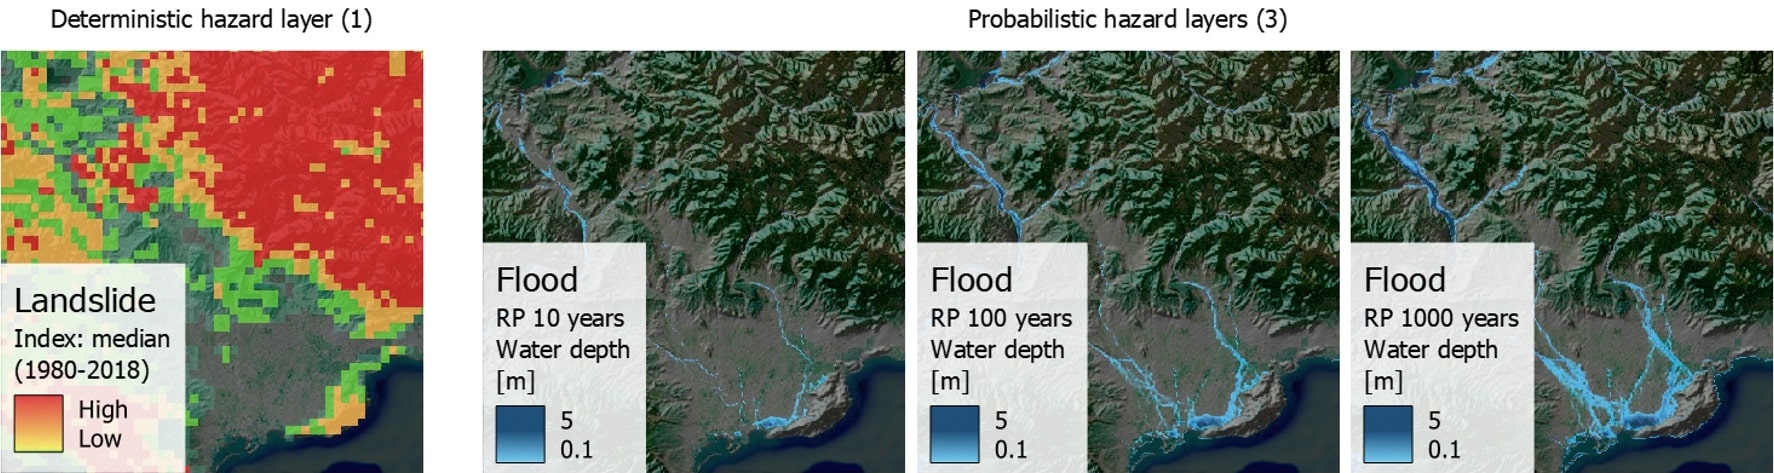
The modelling of hazard intensity (sometimes called magnitude) can be described in different ways:
Deterministic, by statistical indices (such as mean, median or maximum) aggregating historical events observations or reanalysis.
Probabilistic, by means of simulations that produce multiple geodata layers, each representing a range of hazard physical intensities corresponding to a specific occurrence frequency, measured as Return Period (RP), in years.
See the picture below as example: the landslide hazard (left) is represented by one aggregated mean index value; while the flood hazard is shown as a series of events (scenarios) of increasing magnitude and decreasing probability. A probabilistic hazard representation is required in order to produce probabilistic risk mapping.
Note
Note that a return period of 1,000 years, while very unlikely, can occur anyday! Therefore it is important to consider all range of probabilities when assessing risk.
RP 1,000 = chance of occurring once every 1,000 years
= 1/1,000 annual occurrence probability (0.001 or 0.1% any given year).
All kind of hazard models carry limitations related to their applicability. Their quality depend on scale, resolution, model quality, training period and related input data quality. As a rule of thumb, their fitness for application in the context of a risk screening or assessment exercise depends on the scale of the risk analysis, i.e. locally-sourced models are expected to be best fitted for local scale assessment (e.g. city level), while global models are best suited for national or sub-national estimates.
In the context of developing countries, however, a global model is often the only available source for a location. In those cases, the application of the global model must be taken with caution and correctly interpreted acknowledging the limitations. See uncertainty.
Caution
When it comes to natural hazards and risk,
See also
An introduction to Geospatial data and GIS.