Environmental factors#
Air pollution#
Air pollution can be measured by the mean annual surface-level concentrations of PM2.5, which is available from 1998 to 2022 [van Donkelaar et al, 2021] at circa 1 km (0.01° × 0.01°) spatial resolution. This dataset combines data from different sources, including NASA MODIS, MISR, and SeaWIFS observations with the GEOS-Chem chemical transport model into a high-resolution map of air pollution. The dataset combines both human-induced PM2.5 emissions, emitted, for instance, by car engines, power plants, as well as fireplaces and biomass burning [NCRD 2014] and natural sources of PM2.5, which include forest fires and desert dust [McDuffie et al. 2021]. These fine particles, smaller than 2.5 micrometers in diameter, pose enormous health risks as they can lodge deeply into the lungs [WHO 2019].
Name |
Surface PM2.5 |
|---|---|
Developer |
ACAG |
Hazard process |
Air pollution |
Resolution |
1 km |
Analysis type |
Deterministic |
Frequency type |
Annual mean |
Time reference |
Baseline (1998-2022) |
Intensity metric |
PM2.5 [ug/m3] |
License |
Open data |
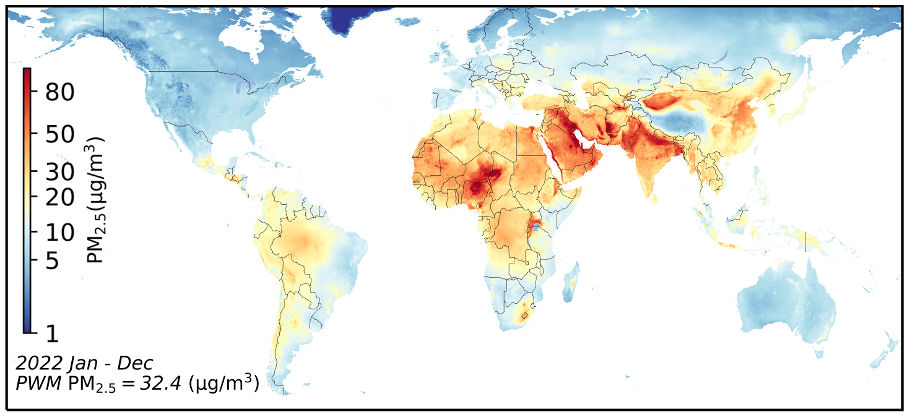
Fig. 18 Annual PM2.5 global concentration: 2022. Source: van Donkelaar et al. / ACAG, Washington University in St. Louis.#
Concentrations of PM2.5 over 15 μg/m3 can lead to severe public health consequences (respiratory infections, cardiovascular disease, and lung cancer), especially in densely populated areas. While not a climate hazard in and of itself, air pollution can be affected by climate change [UCAR 2022], but can also affect local climate: drier conditions can promote dust transport from soil; wildfires can increase the local dust concentration; high dust can alter the heat intake from the sun and thus affect temperatures.