Custom Hazard Analytics#
Input data management#
This script is meant for custom input from the user on all three risk components. It can still fetch national and sub-national boundaries from the WB ArcGIS repository.
The exposure data and the hazard data selected by the user need to be manually downloaded and placed in the respective folders; in case of tiled data, use the pre-processing script to merge those into country-sized data. Each dataset is expected as a raster file (.tif).
Example:
Work dir/
 - GUI.ipynb		Place the notebooks and related files in the main work directory
 - common.py
 - ...
 - Data/
   - HZD/country_hazard.tif				Hazard layers
   - EXP/country_exposure.tif				Exposure layers
   - RSK/						Output directory
Caution
All spatial data must use the same CRS: EPSG 4326 (WGS 84)
Running the analysis#
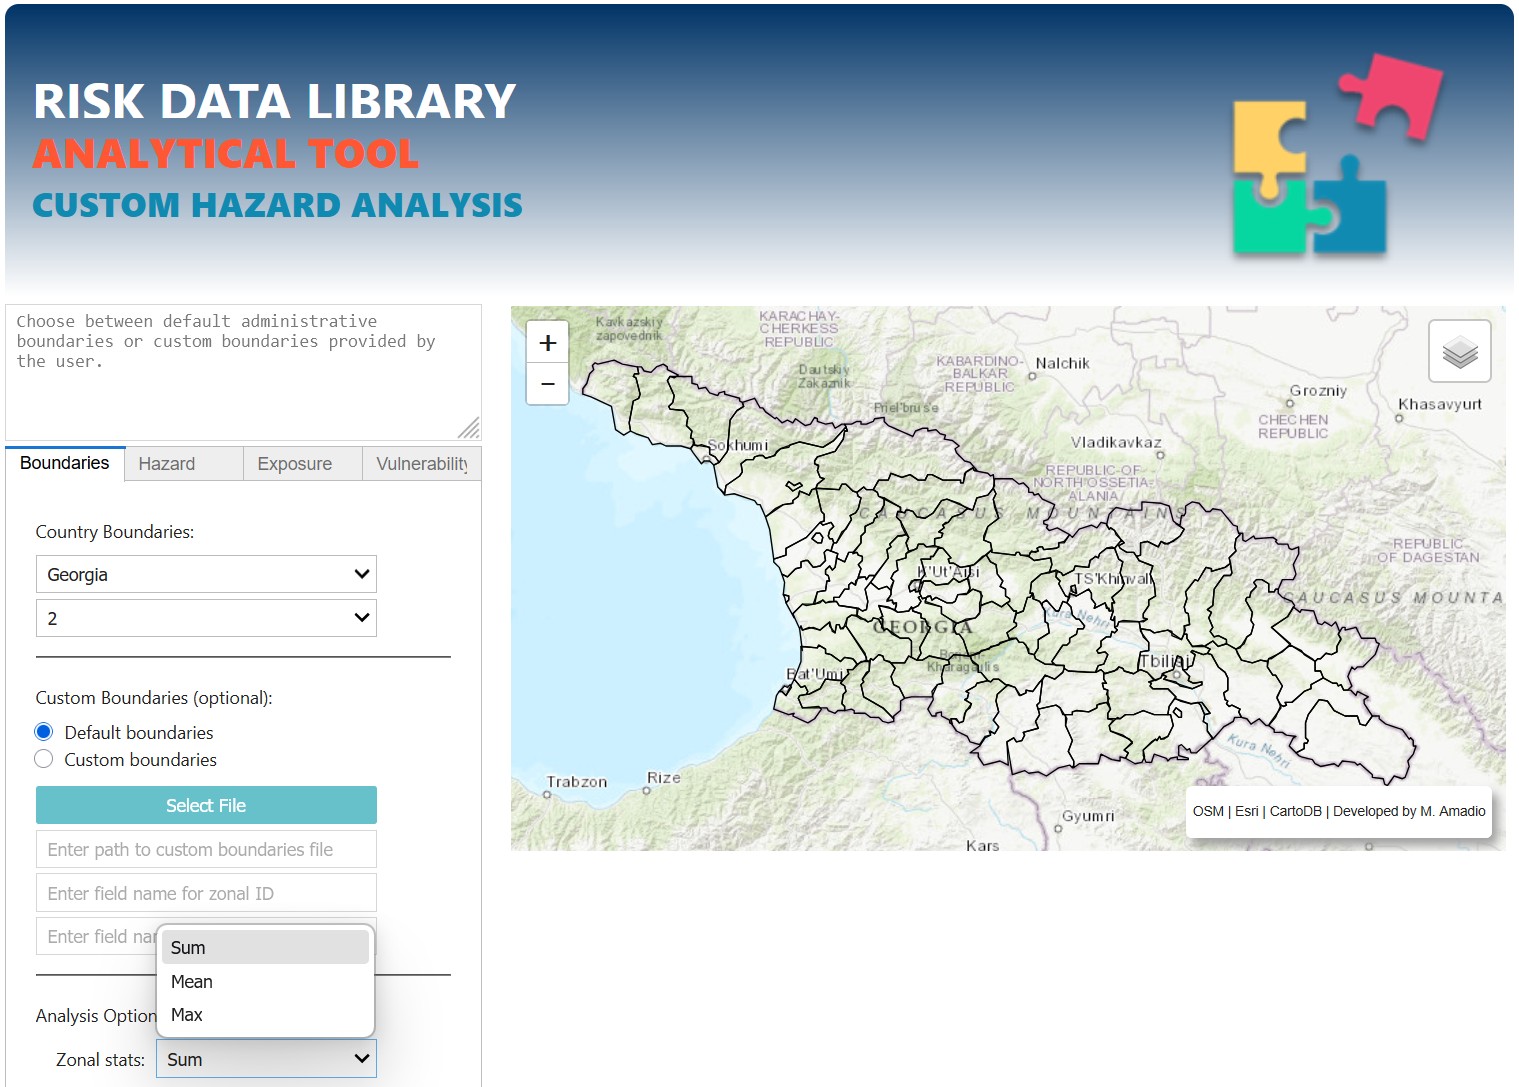
Boundaries tab: sub-national boundaries for level 0, 1 and 2 can be fetched automatically. Else, you can load custom boundaries as geopackage (WGS 84). You will need to specify the field to be used to run zonal statistics, and related label name (e.g. ADM3_PCODE and ADM3_EN).
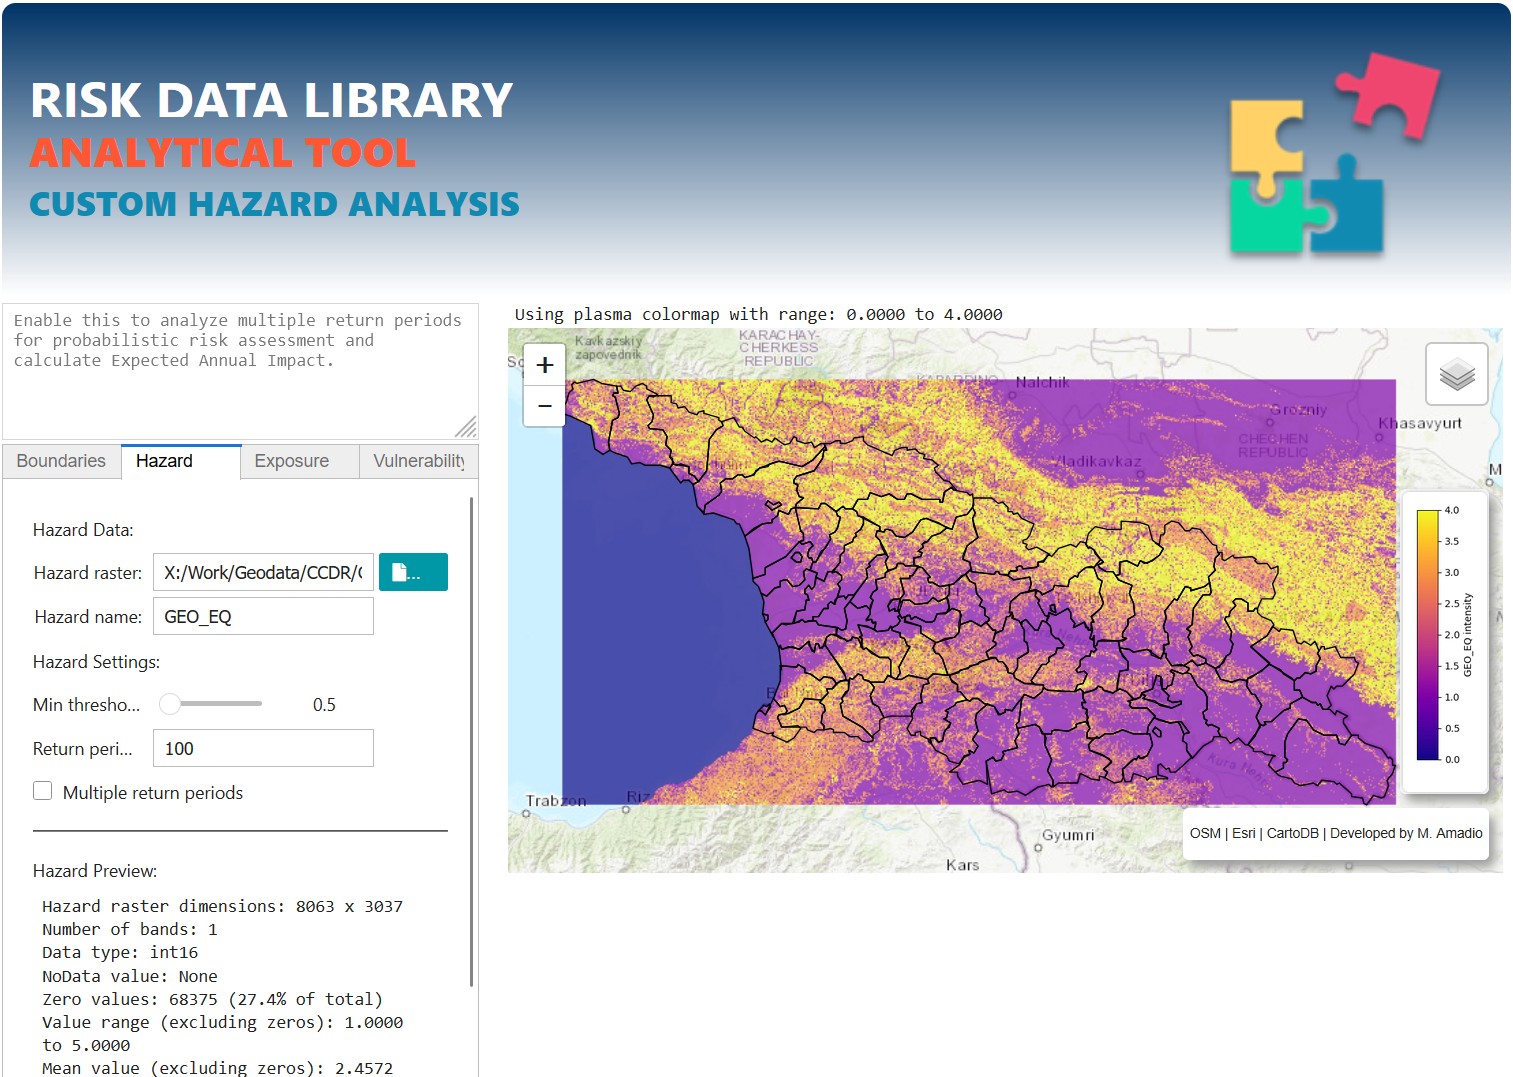
Hazard tab: select the hazard data (*.tif), the hazard name, the minimum hazard intensity threshold (all values below that will be ignored), and the associated frequency, if any. You can also select more than one layer in case of multiple return periods.
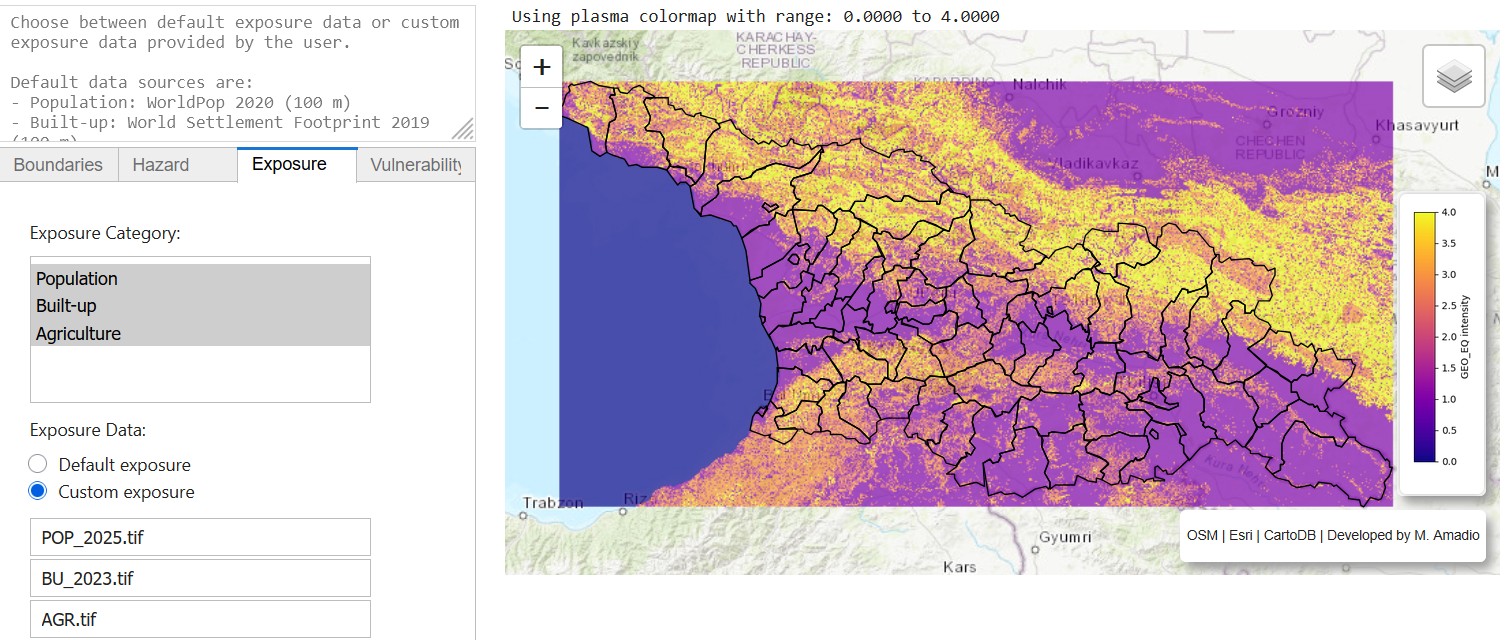
Exposure tab: select one or more categories (CTRL+Click / drag mouse). The default data will be added (if found), else you can select a custom exposure layer for each selected category (.tif raster, WGS 84).
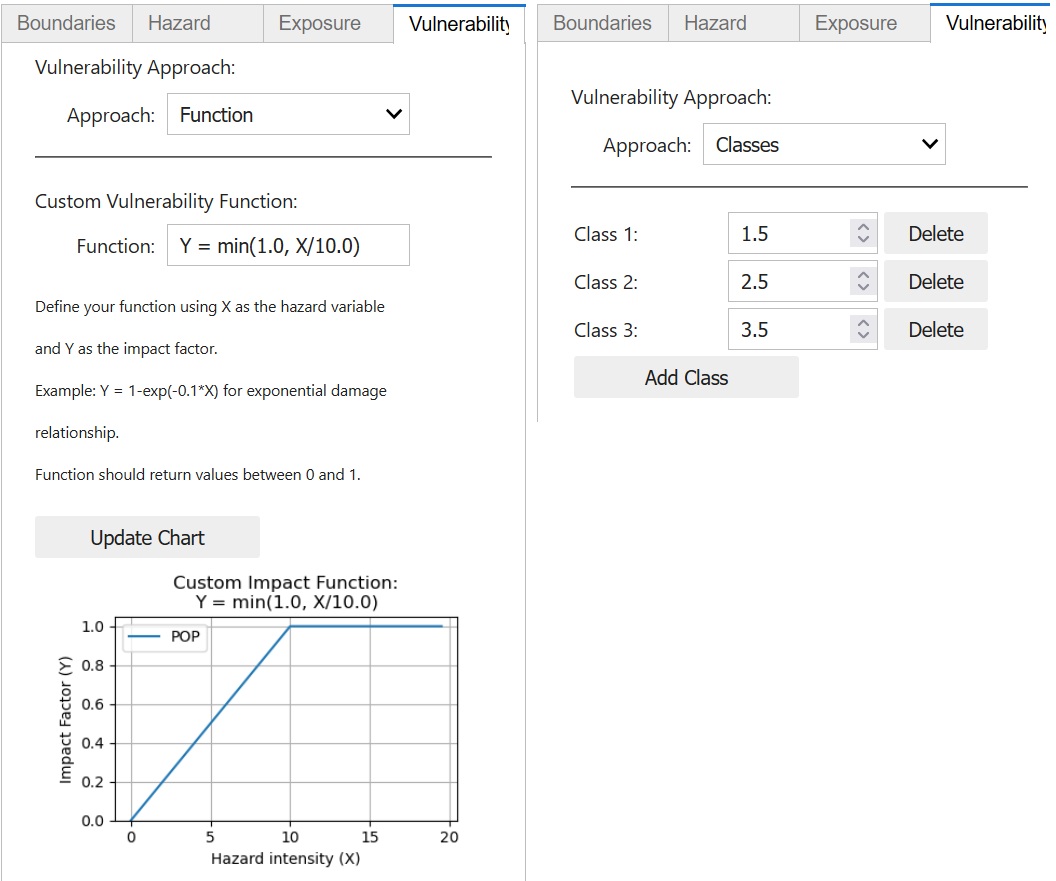
Vulnerability tab: first you need to select the approach.
When using “function”, you can enter a mathematical impact function for the selected country and exposure categories.
When using “classes”, hazard intensity thresholds must be specified.
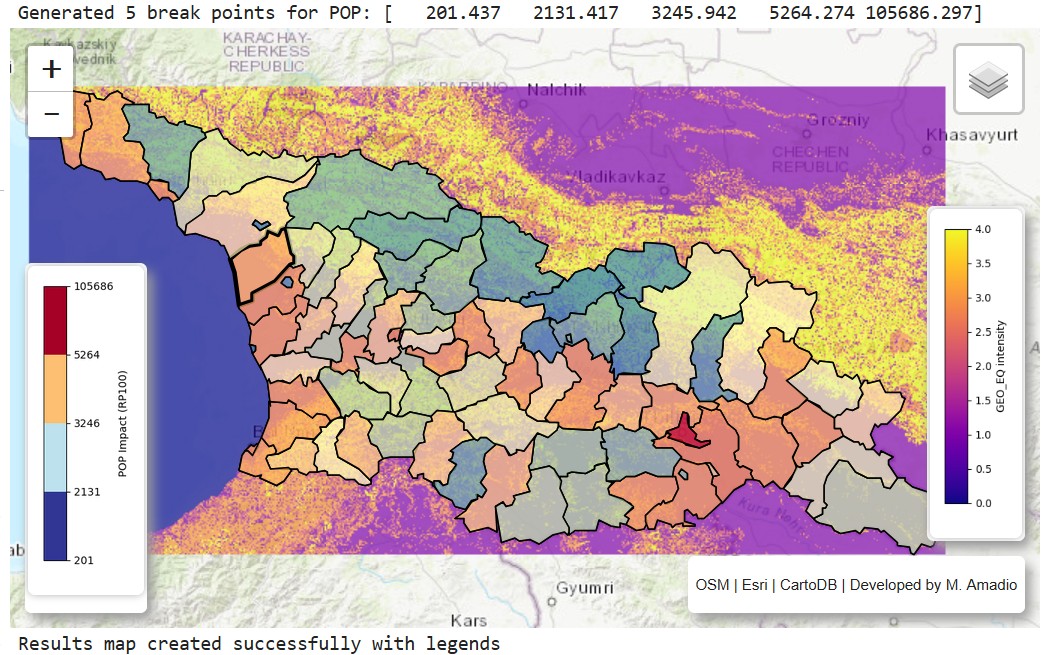
Check “Preview results” to generate map and charts output in the GUI. Map data is saved in the output folder as .gpkg. You can load it in GIS software for more customised map visualisation.