Climate Indices Analytics#
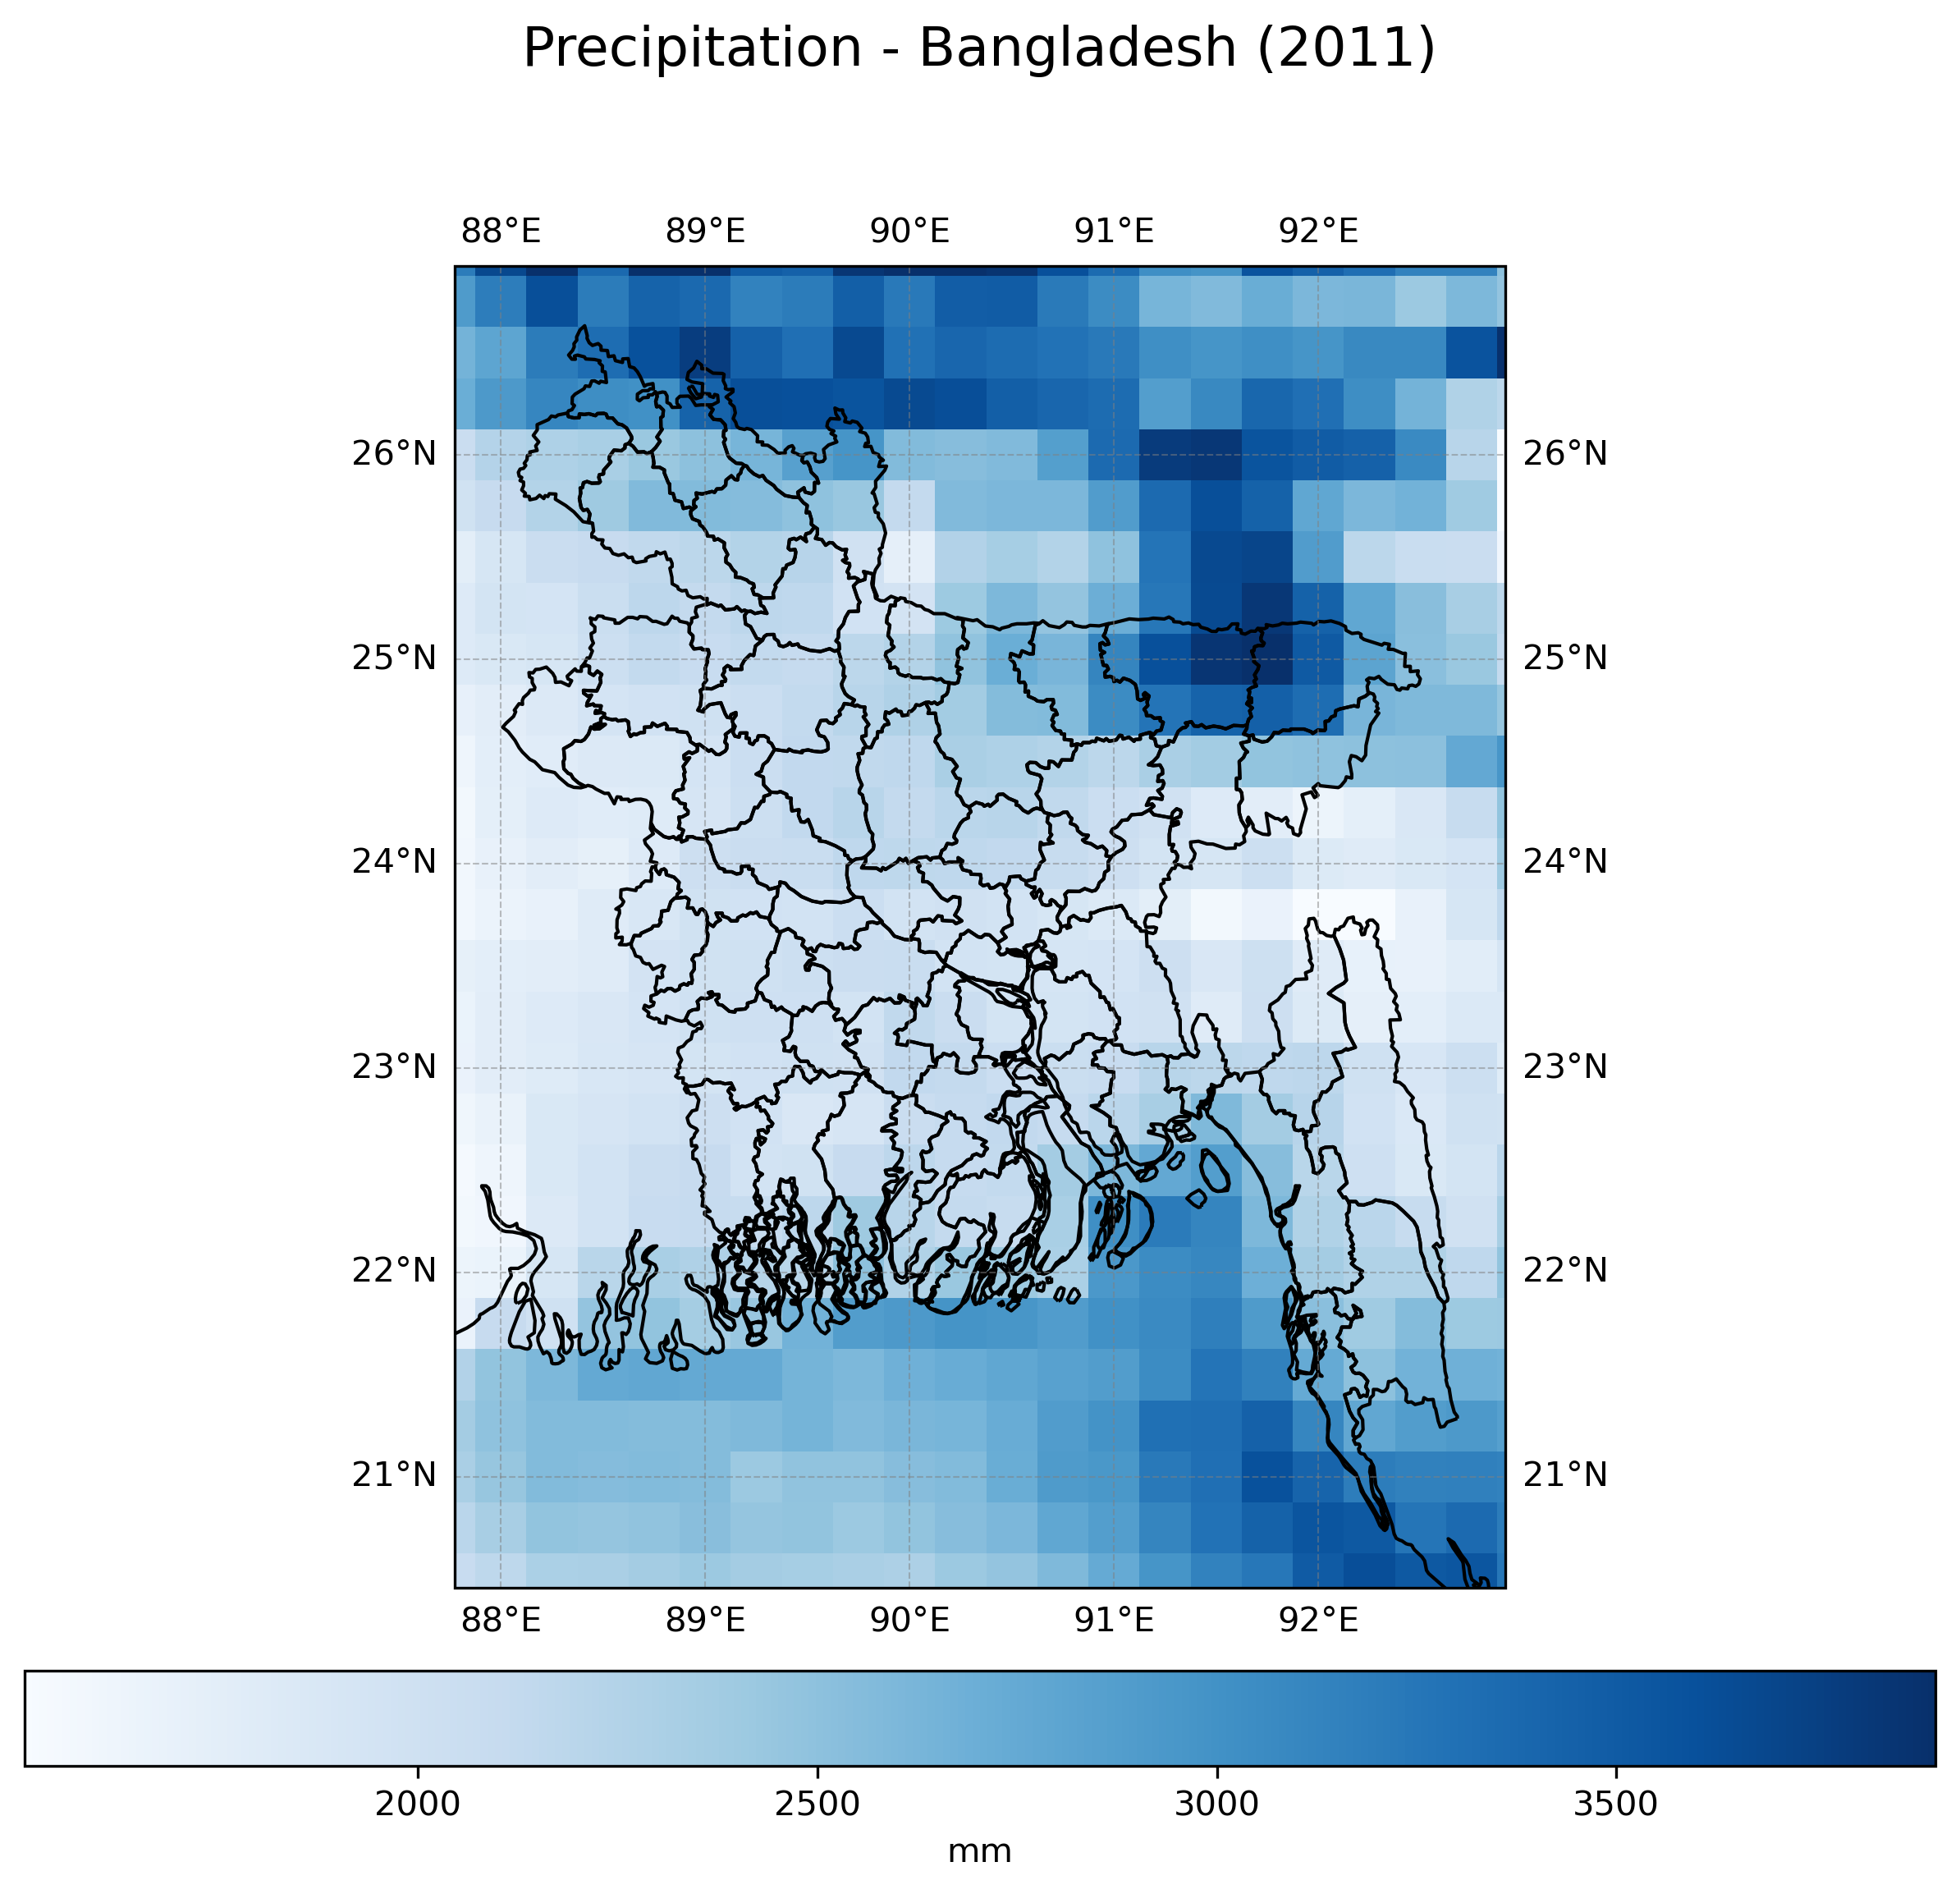
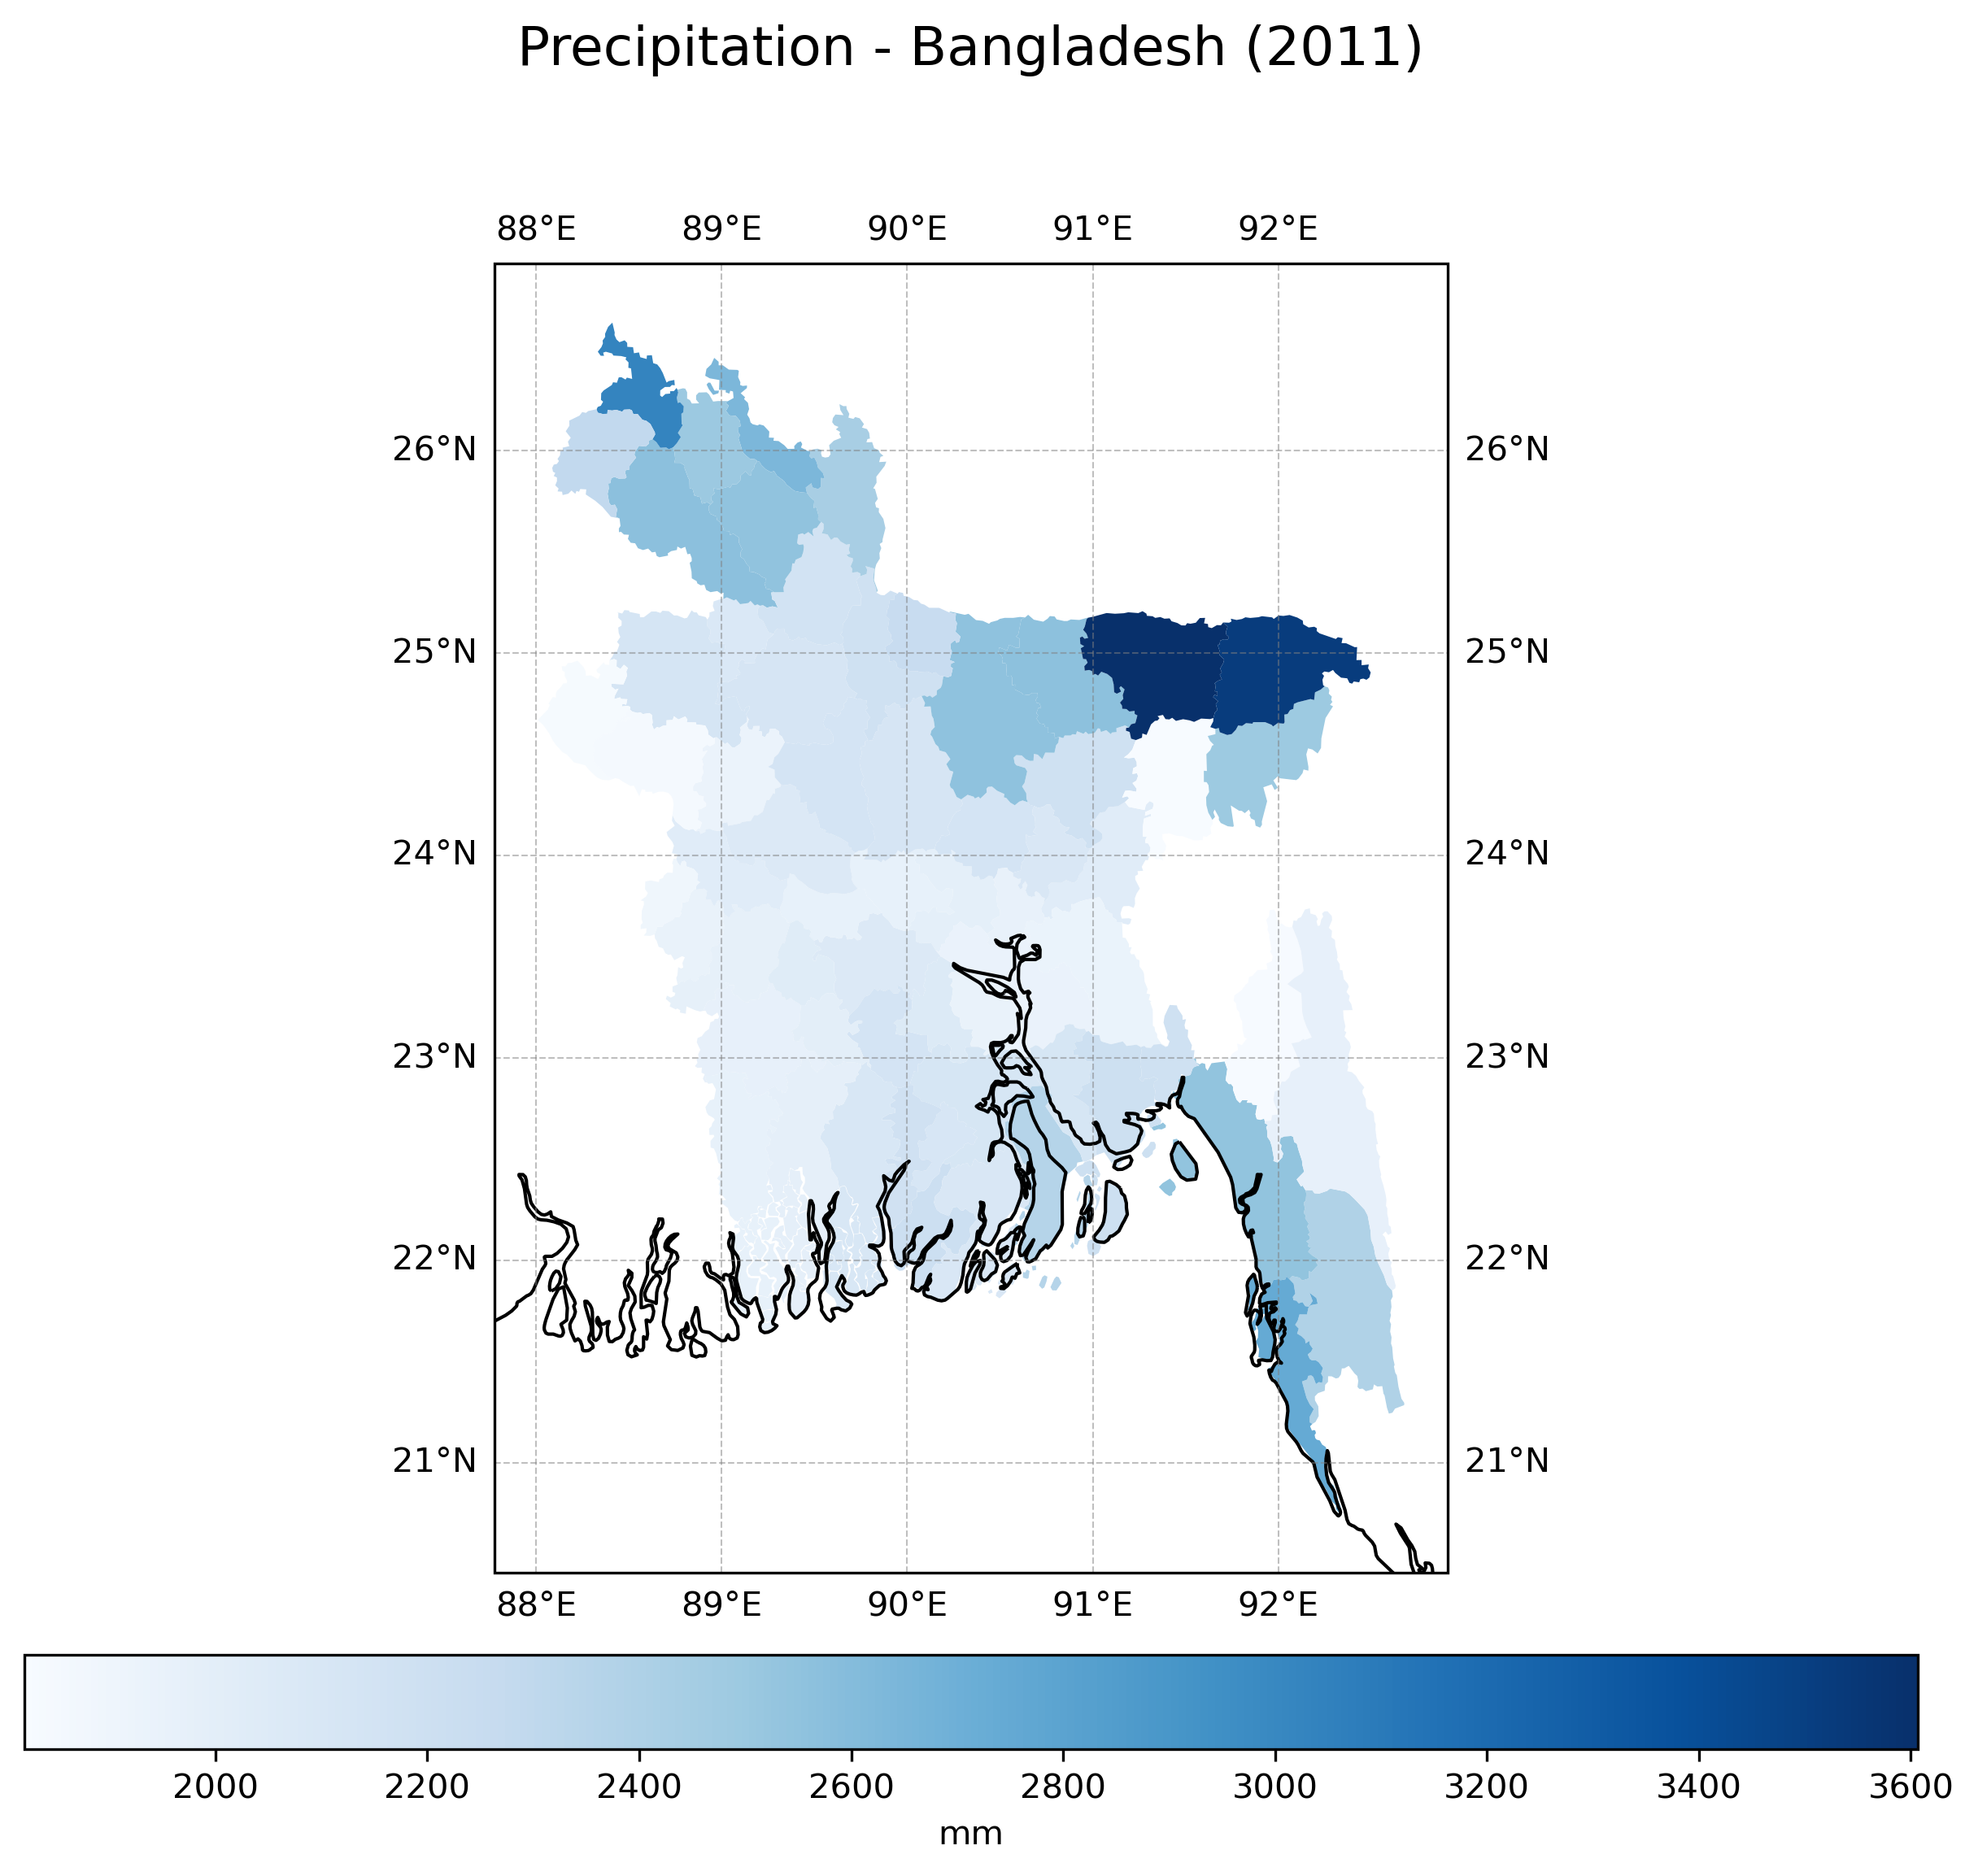
Choose from a selection of climate indices to analyze temperature extremes, precipitation patterns, heat stress indicators, and drought metrics. Select a country, administrative level, climate index, and a specific year to visualize both raw grid data and zonal statistics. Subnational boundaries are fetched from the WB server up to level 2. Custom boundaries at any level can also be used. Results can be exported as pictures and geodata.
There are two notebooks for the visualisation and extraction of climate indices
Historical Timeseries Visualization Tool: visualize and extract mean annual values of climate indices for historical period (1950-2023) at country level.
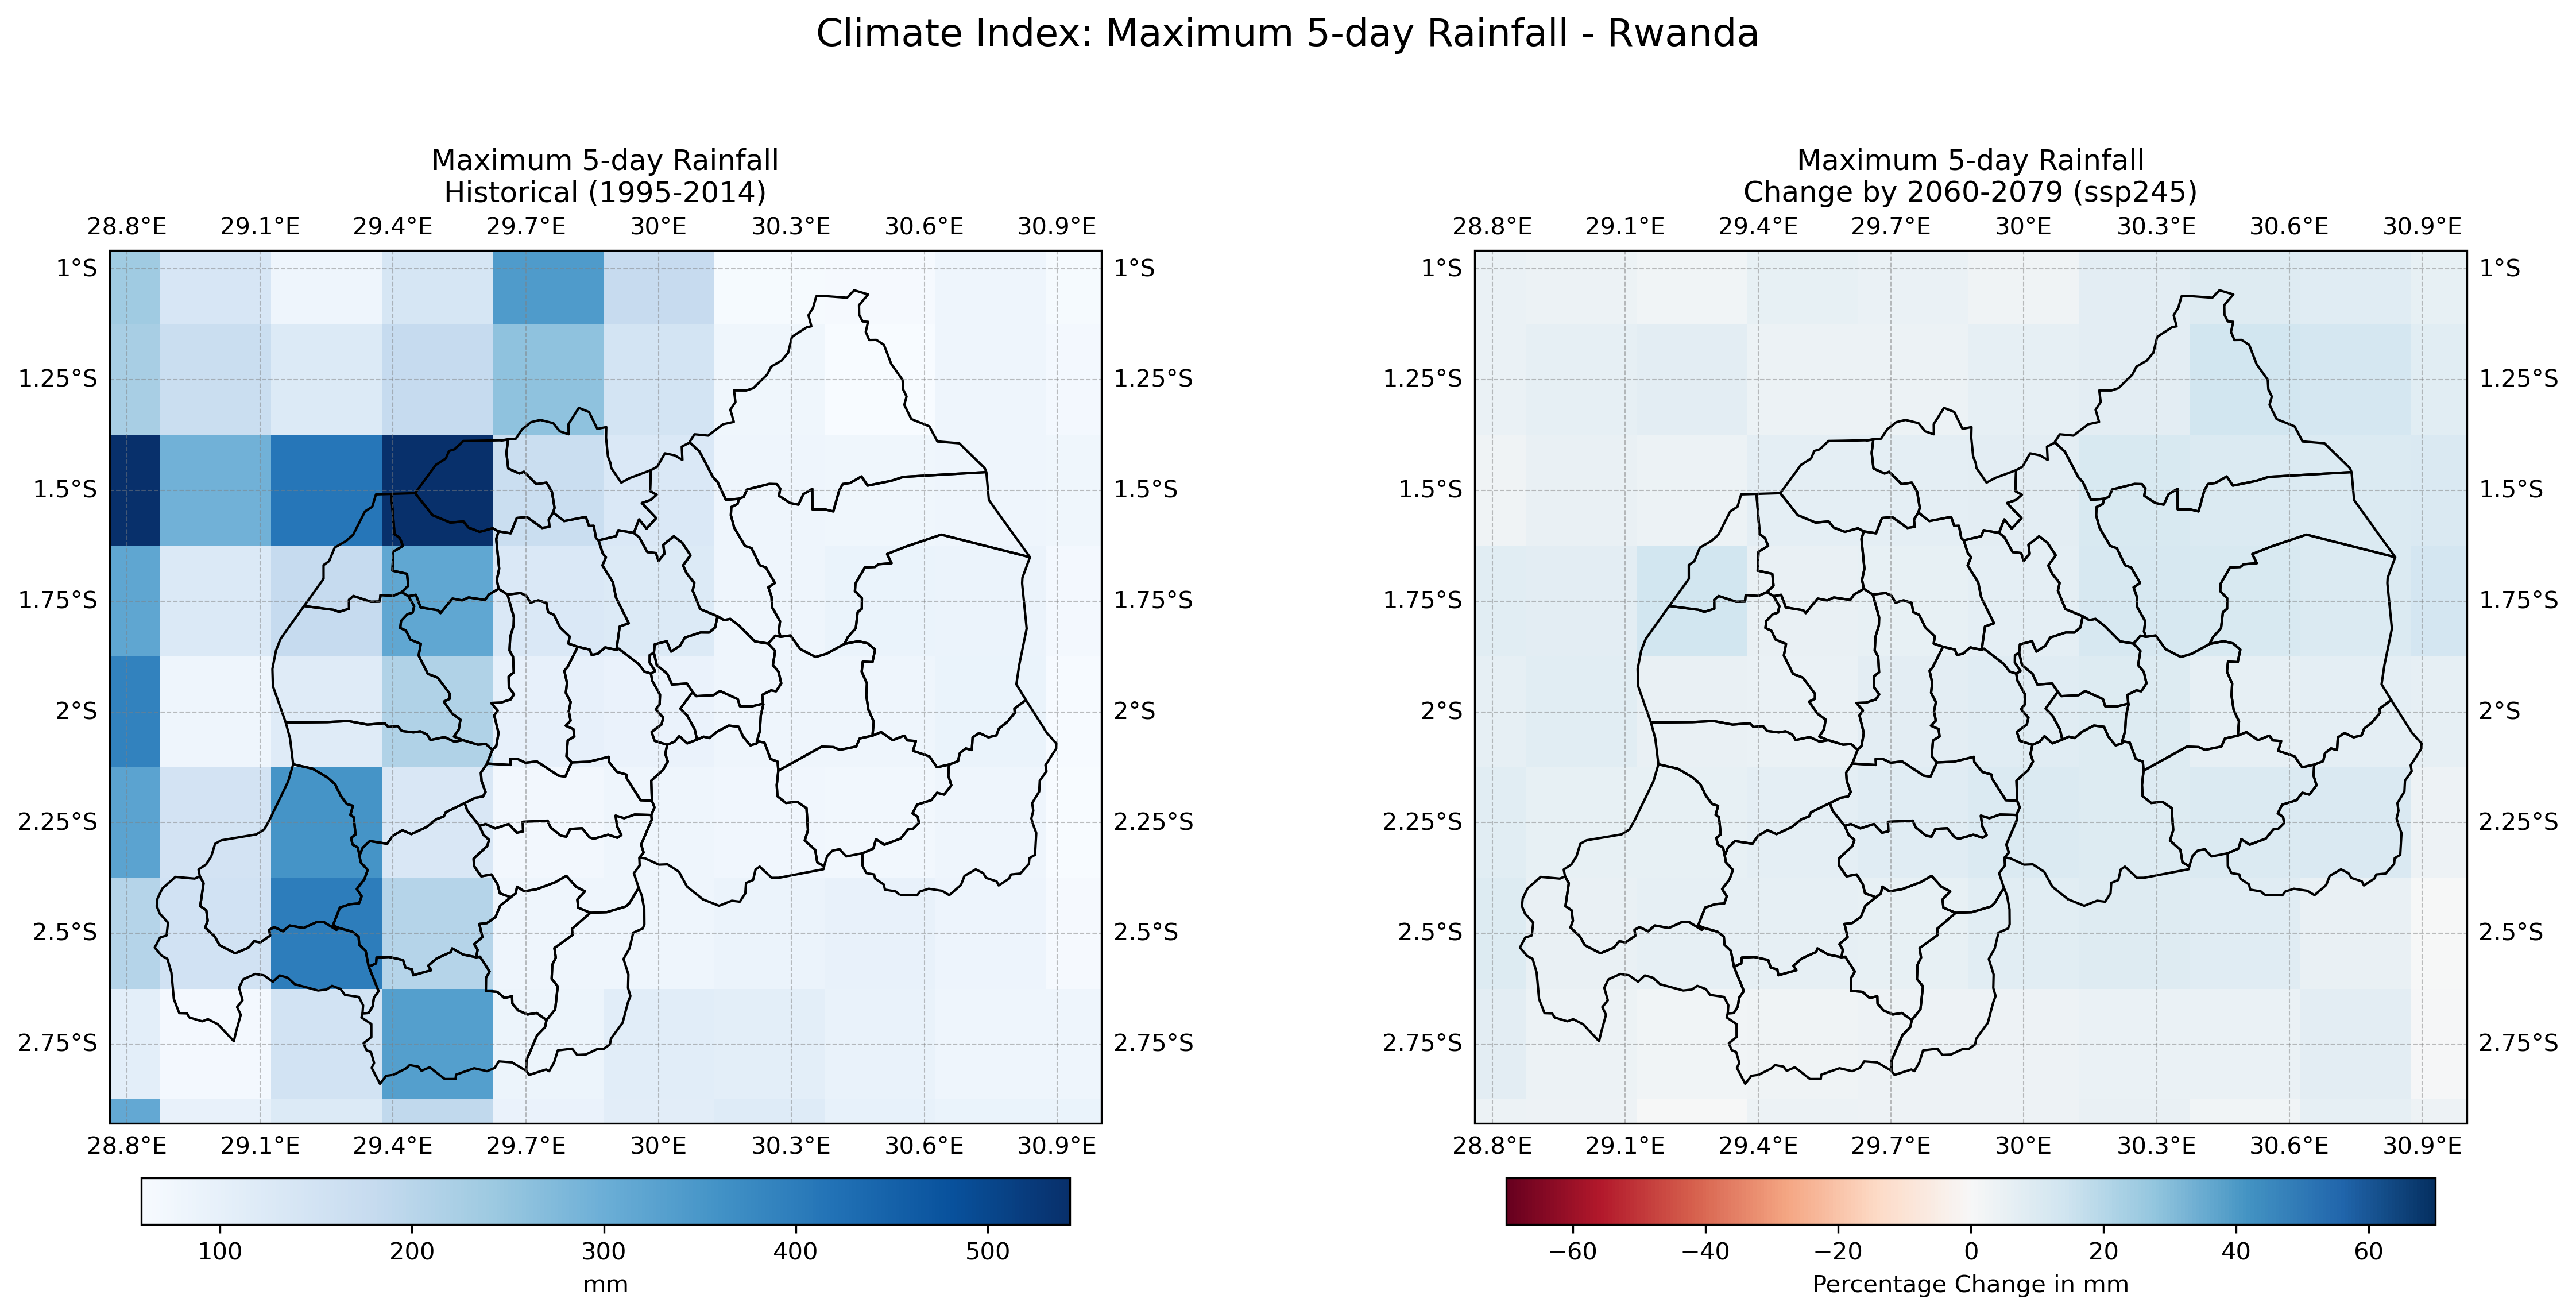
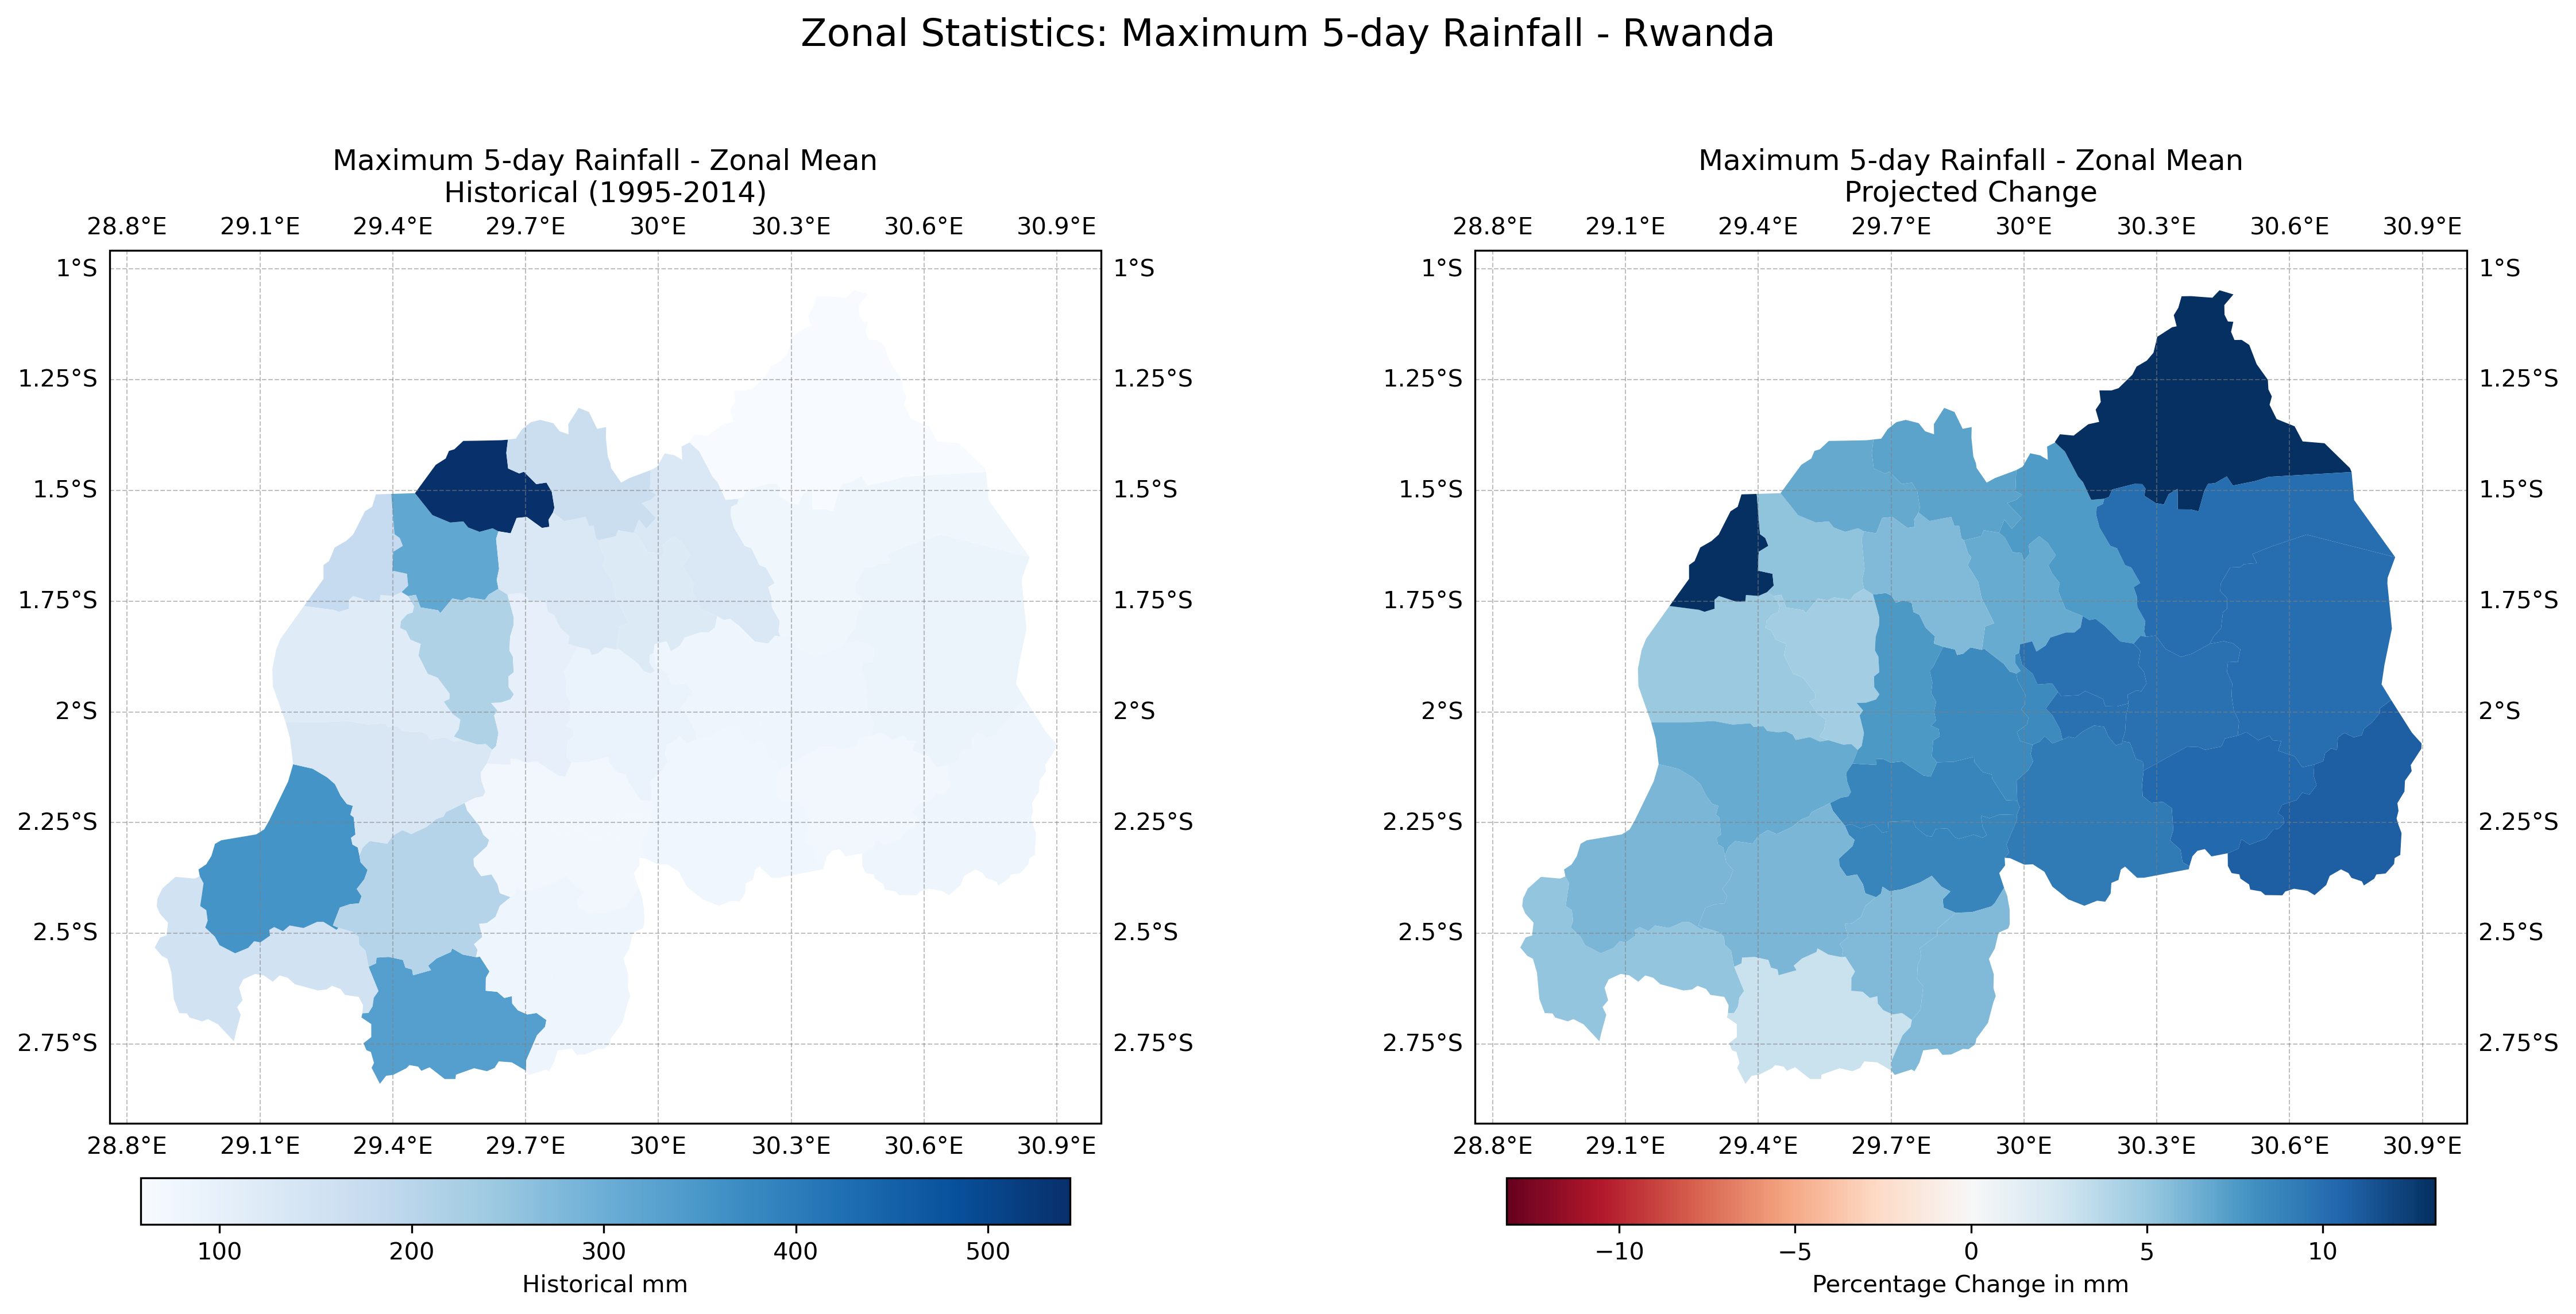
Projections Anomaly Visualization Tool: visualize historical mean and projected anomalies for 20-year periods up to end of the century.
Reference Guide#
Data Source#
This tool uses ERA5 reanalysis data, which provides a consistent global dataset of climate variables from 1950 to present; and CMIP6 data, which provides projections of anomaly values for the same climate variables, up to end of the century. The ensemble median of the climatology (20 years average) is used for the calculation. Data are sourced at 0.25° resolution from the World Bank Climate Knowledge Portal.
Climate Indices Overview#
Type |
Index |
Description |
Unit |
|---|---|---|---|
Temperature |
tas, tasmax, tasmin |
Mean, max and min temperature |
°C |
Heat Stress |
hd30, hd35, hi35, hi39 |
Days with Tmax > 30°C, 35°C or Heat Index > 35°C, 39°C |
days |
Heat Risk |
tx84rr |
Heat risk categorization and excess mortality indices |
index |
Precipitation |
rx1day, rx5day |
Maximum 1-day and 5-day rainfall |
mm |
Rain Intensity |
r20mm, r50mm |
Days with precipitation > 20mm or 50mm |
days |
Wet/Dry Periods |
cwd, cdd |
Consecutive wet/dry days |
days |
Drought |
spei12 |
Standardized Precipitation-Evapotranspiration Index |
index |
SSP Scenarios#
SSP1-1.9: Sustainability — very low emissions, consistent with limiting warming to 1.5 °C
SSP1-2.6: Sustainability — low emissions, consistent with limiting warming to below 2 °C
SSP2-4.5: Middle of the road - medium challenges to mitigation and adaptation
SSP3-7.0: Regional rivalry - high challenges to mitigation and adaptation
SSP5-8.5: Fossil-fueled development - high challenges to mitigation, low challenges to adaptation
Running the analysis#
Historical Timeseries Visualization Tool#
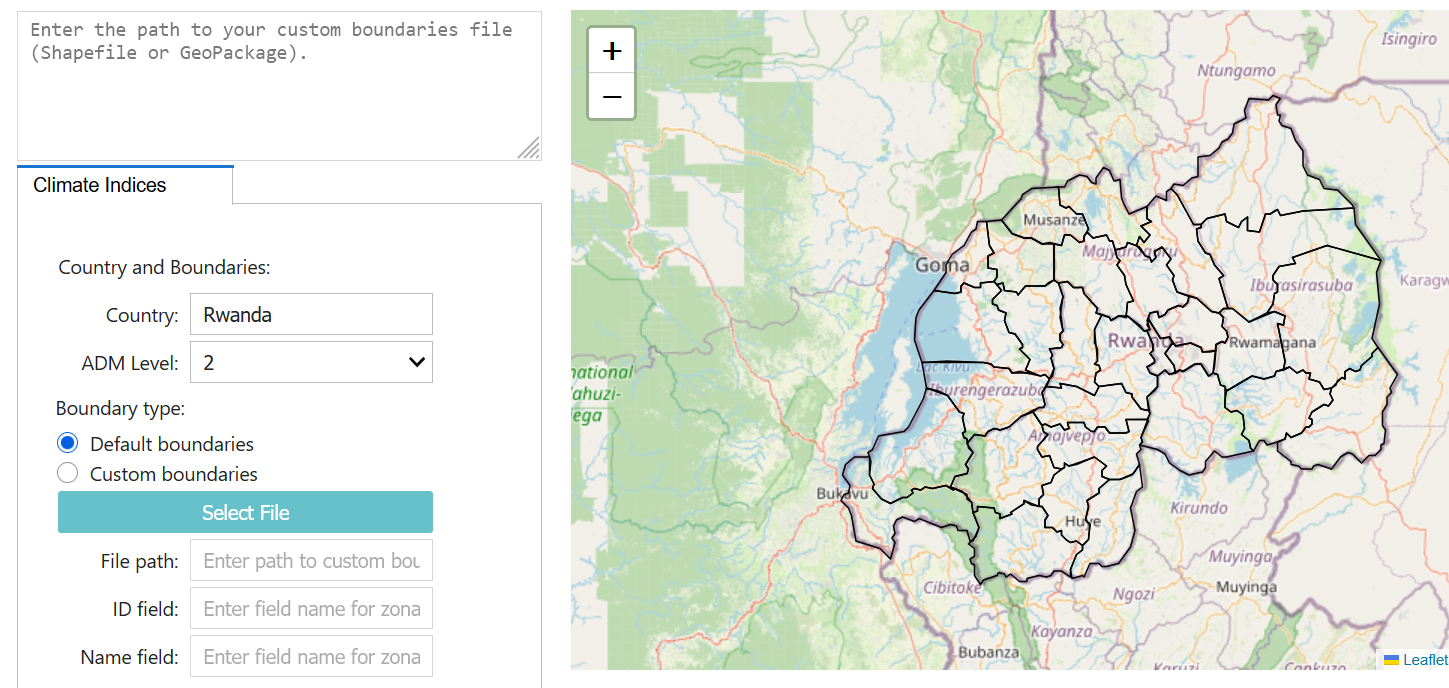
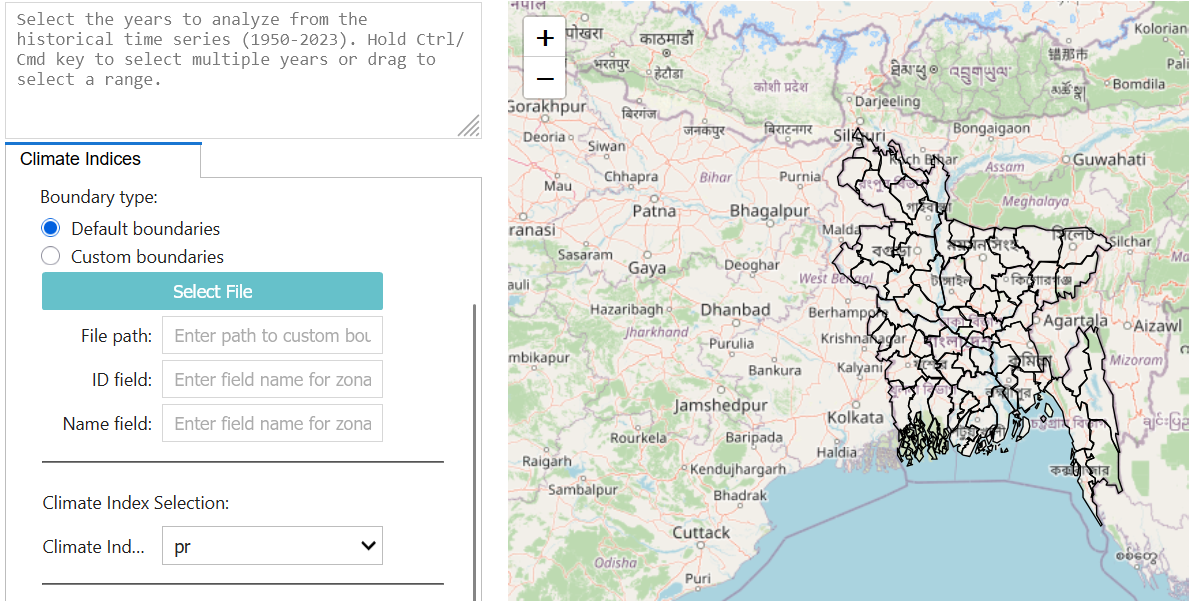
Select the country first. Sub-national boundaries for level 1 and 2 can be fetched automatically. Else, you can load custom boundaries as geopackage (WGS 84). You will need to specify the field to be used to run zonal statistics, and related label name (e.g. ADM3_PCODE and ADM3_EN).
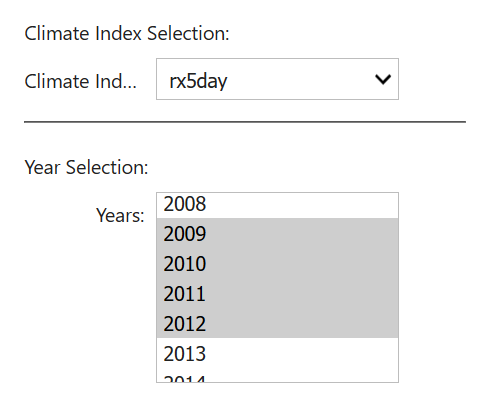
Next select the climate index to extract, then the years of interest. Drag mouse for multiple selection.
Run the analysis and wait for results.
Projections Anomaly Visualization Tool#
Select the country first. Sub-national boundaries for level 1 and 2 can be fetched automatically. Else, you can load custom boundaries as geopackage (WGS 84). You will need to specify the field to be used to run zonal statistics, and related label name (e.g. ADM3_PCODE and ADM3_EN).
Next select the climate index to extract, then the period and scenario of interest.
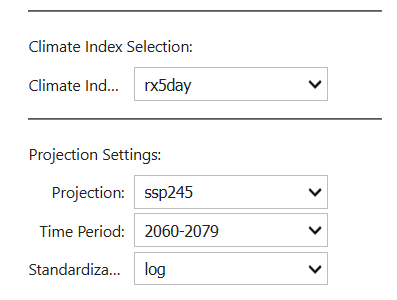
You can choose to apply a standardization to the anomaly calculation. Standardisation expresses the future change in relation to the historical mean, thus normalising the values in relation to local climatology.
None: Shows raw anomaly values (future minus present)
Epsilon: Shows percentage change with stability for near-zero values (0 + epsilon)
Log: Shows logarithmic change ratio (best for precipitation)
Run the analysis and wait for results.