Impact and risk#
In this framework, Risk (R) is calculated as a function of: the hazard occurrence probability and intensity (i.e., physical magnitude) in a particular location (H, for Hazard); the people and physical assets (infrastructure, buildings, crops, etc.) situated in that location and therefore exposed to the hazard (E, for Exposure); and the conditions determined by physical, social, and economic factors which increase the susceptibility of an exposed individual, community, asset or system to the impacts of hazards (V, for Vulnerability).
Risk = Hazard x Exposure x Vulnerability
See also
Disaster risk is expressed as the likelihood of loss of life, injury or destruction and damage from a disaster in a given period of time (UNDRR 2019).
Measures of exposure can include the number of people or types of assets in an area. These can be combined with the specific vulnerability and capacity of the exposed elements to any particular hazard to estimate the quantitative risks associated with that hazard in the area of interest.
From these definitions, we understand that the concept of risk is inherently tied to the concept of probability, expressed in terms of frequency (also occurrence rate). In other words:
Risk = Probability x Impact
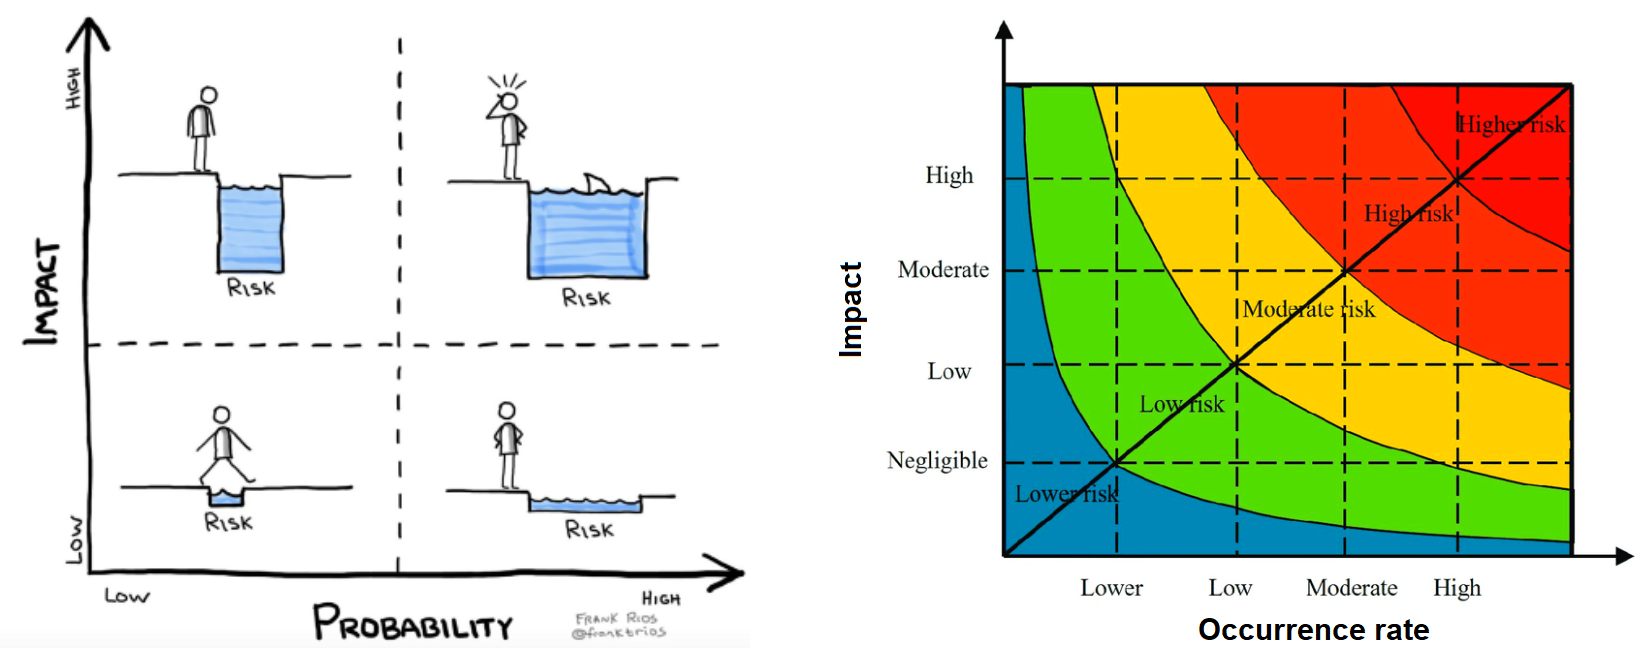
Fig. 5 Risk as impact - probability combination.#
While historical losses can explain the past, they do not necessarily provide a good guide to the future; most disasters that could happen have not happened yet. Probabilistic risk assessment simulates those future disasters which, based on scientific evidence, are likely to occur. As a result, these risk assessments resolve the problem posed by the limits of historical data. Probabilistic models therefore complement historical records by reproducing the physics and/or the statistics/statistical distribution of the phenomena and recreating the intensity of a large number of synthetic events.
Note
In the context of disaster risk, probability refers to the frequency of occurrence, or return period of impacts associated with an hazard event of given intensity.
Probabilistic risk is the chance of something adverse (impact) occurring. This method assesses the likelihood of an event(s) and it contains the idea of uncertainty because it incorporates the variability between frequent, low impact events and rare, high impact events.
In contrast, a deterministic risk model typically models one scenario representing a real event or an individual, finite risk scenario (e.g. mean, median, worst case), but cannot properly represent the full range of variability around it.
Direct and indirect losses#
Direct disaster losses refer to directly quantifiable losses such as the number of people killed and the damage to buildings, infrastructure and natural resources.
Indirect disaster losses include declines in output or revenue, and impact on wellbeing of people, and generally arise from disruptions to the flow of goods and services as a result of a disaster [GFDRR 2014; UNDRR].
In this specific framework, we are only estimating DIRECT disaster losses in terms of impacts on mortality and built-up damage.
Impact as spatial Combination of Hazard, Exposure and Vulnerability#
The spatial analysis of disaster risk requires the systematic combination of three fundamental components: hazard, exposure, and vulnerability. This process enables quantitative assessment of potential impacts by identifying where hazardous events intersect with vulnerable assets and populations.
Methodology Overview#
To demonstrate this spatial combination approach, consider the analysis of flood risk using three 90-meter resolution raster datasets:
Hazard layer: Flood extent and intensity data
Exposure layers: Built-up assets and population distribution
Vulnerability model: Damage functions specific to the hazard-exposure combination
Step 1: Hazard-Exposure Intersection#
The first step involves overlaying the hazard layer with exposure data to identify areas at risk. The spatial intersection of these layers defines the exposure zone – areas where assets and populations could potentially be affected by the hazard event.
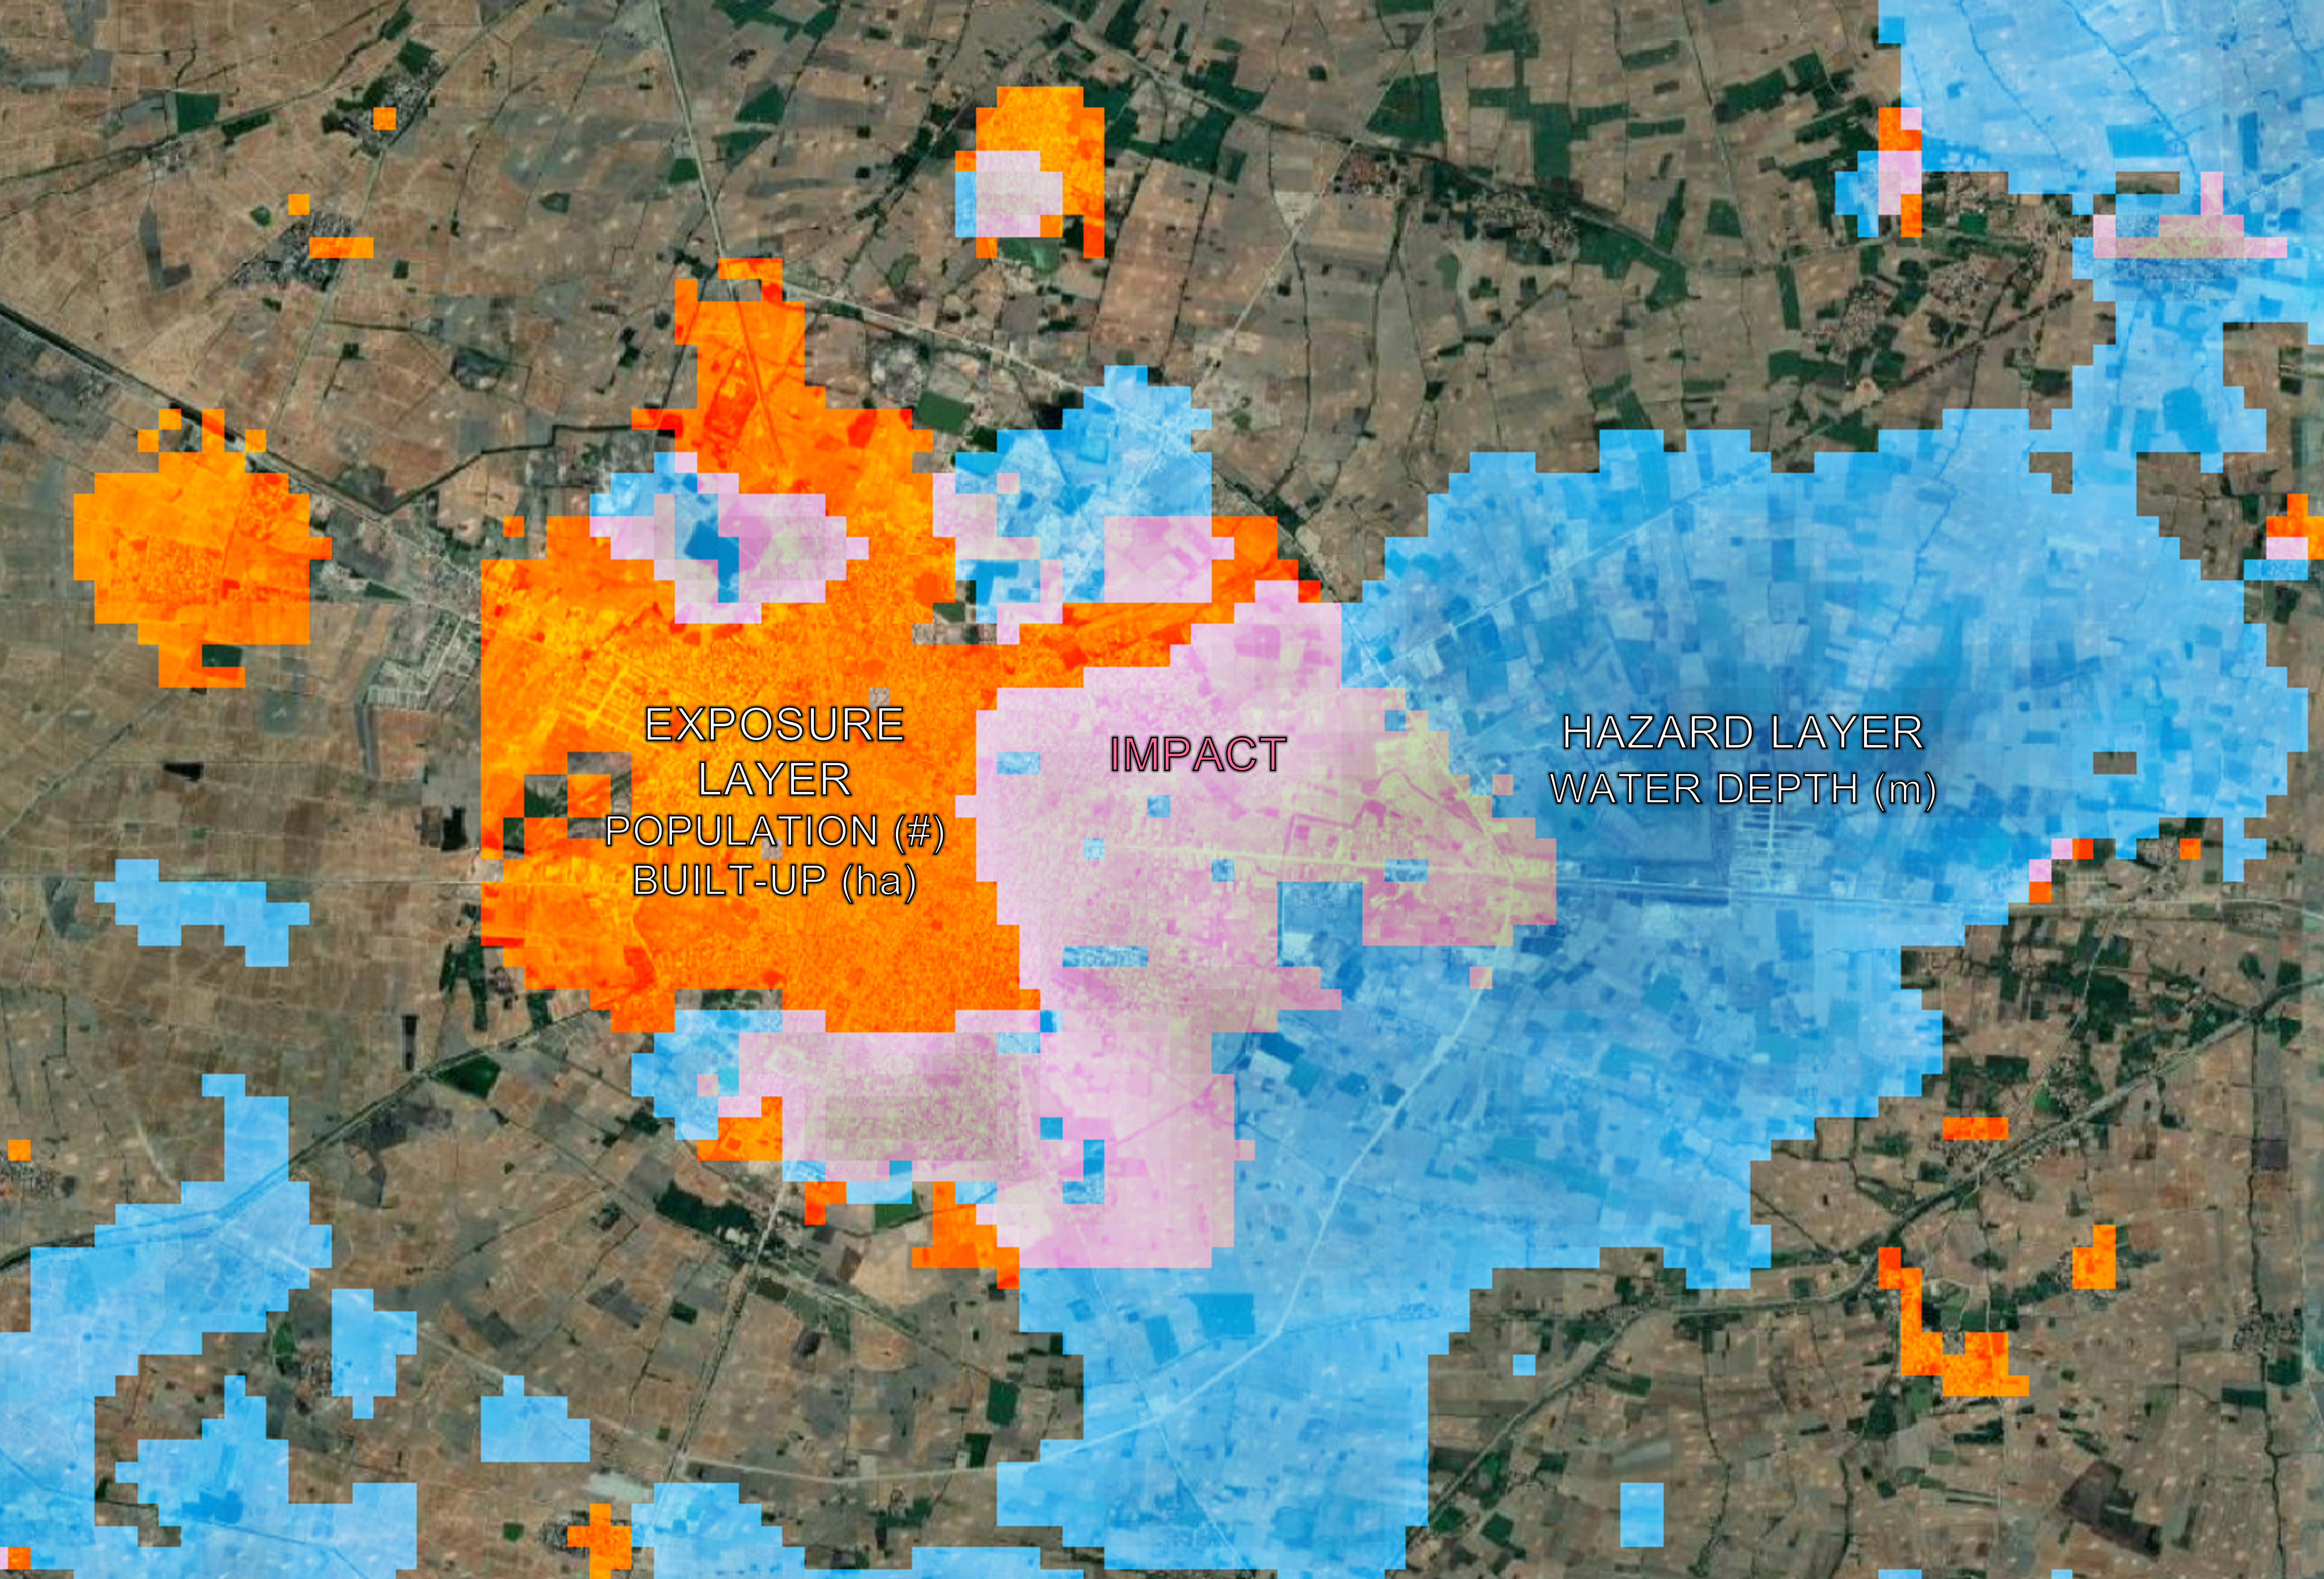
Fig. 6 The spatial intersection of a hazard layer (blue) with an exposure layer (orange) defines the amount of assets (pink) exposed to potential impact from the hazard.#
This intersection provides crucial information about:
Geographic extent of potential impacts
Quantity of exposed assets within the hazard zone
Distribution patterns of exposure across the study area
Step 2: Incorporating Vulnerability#
While the hazard-exposure intersection identifies what could be affected, it doesn’t quantify how much damage might occur. This requires integrating vulnerability information through damage functions or impact models.
When vulnerability models are available for the specific hazard-exposure combination, impact factors can be applied to transform exposure data into quantitative damage estimates. These models typically express vulnerability as a function that relates hazard intensity to the expected fraction of asset value that could be lost.
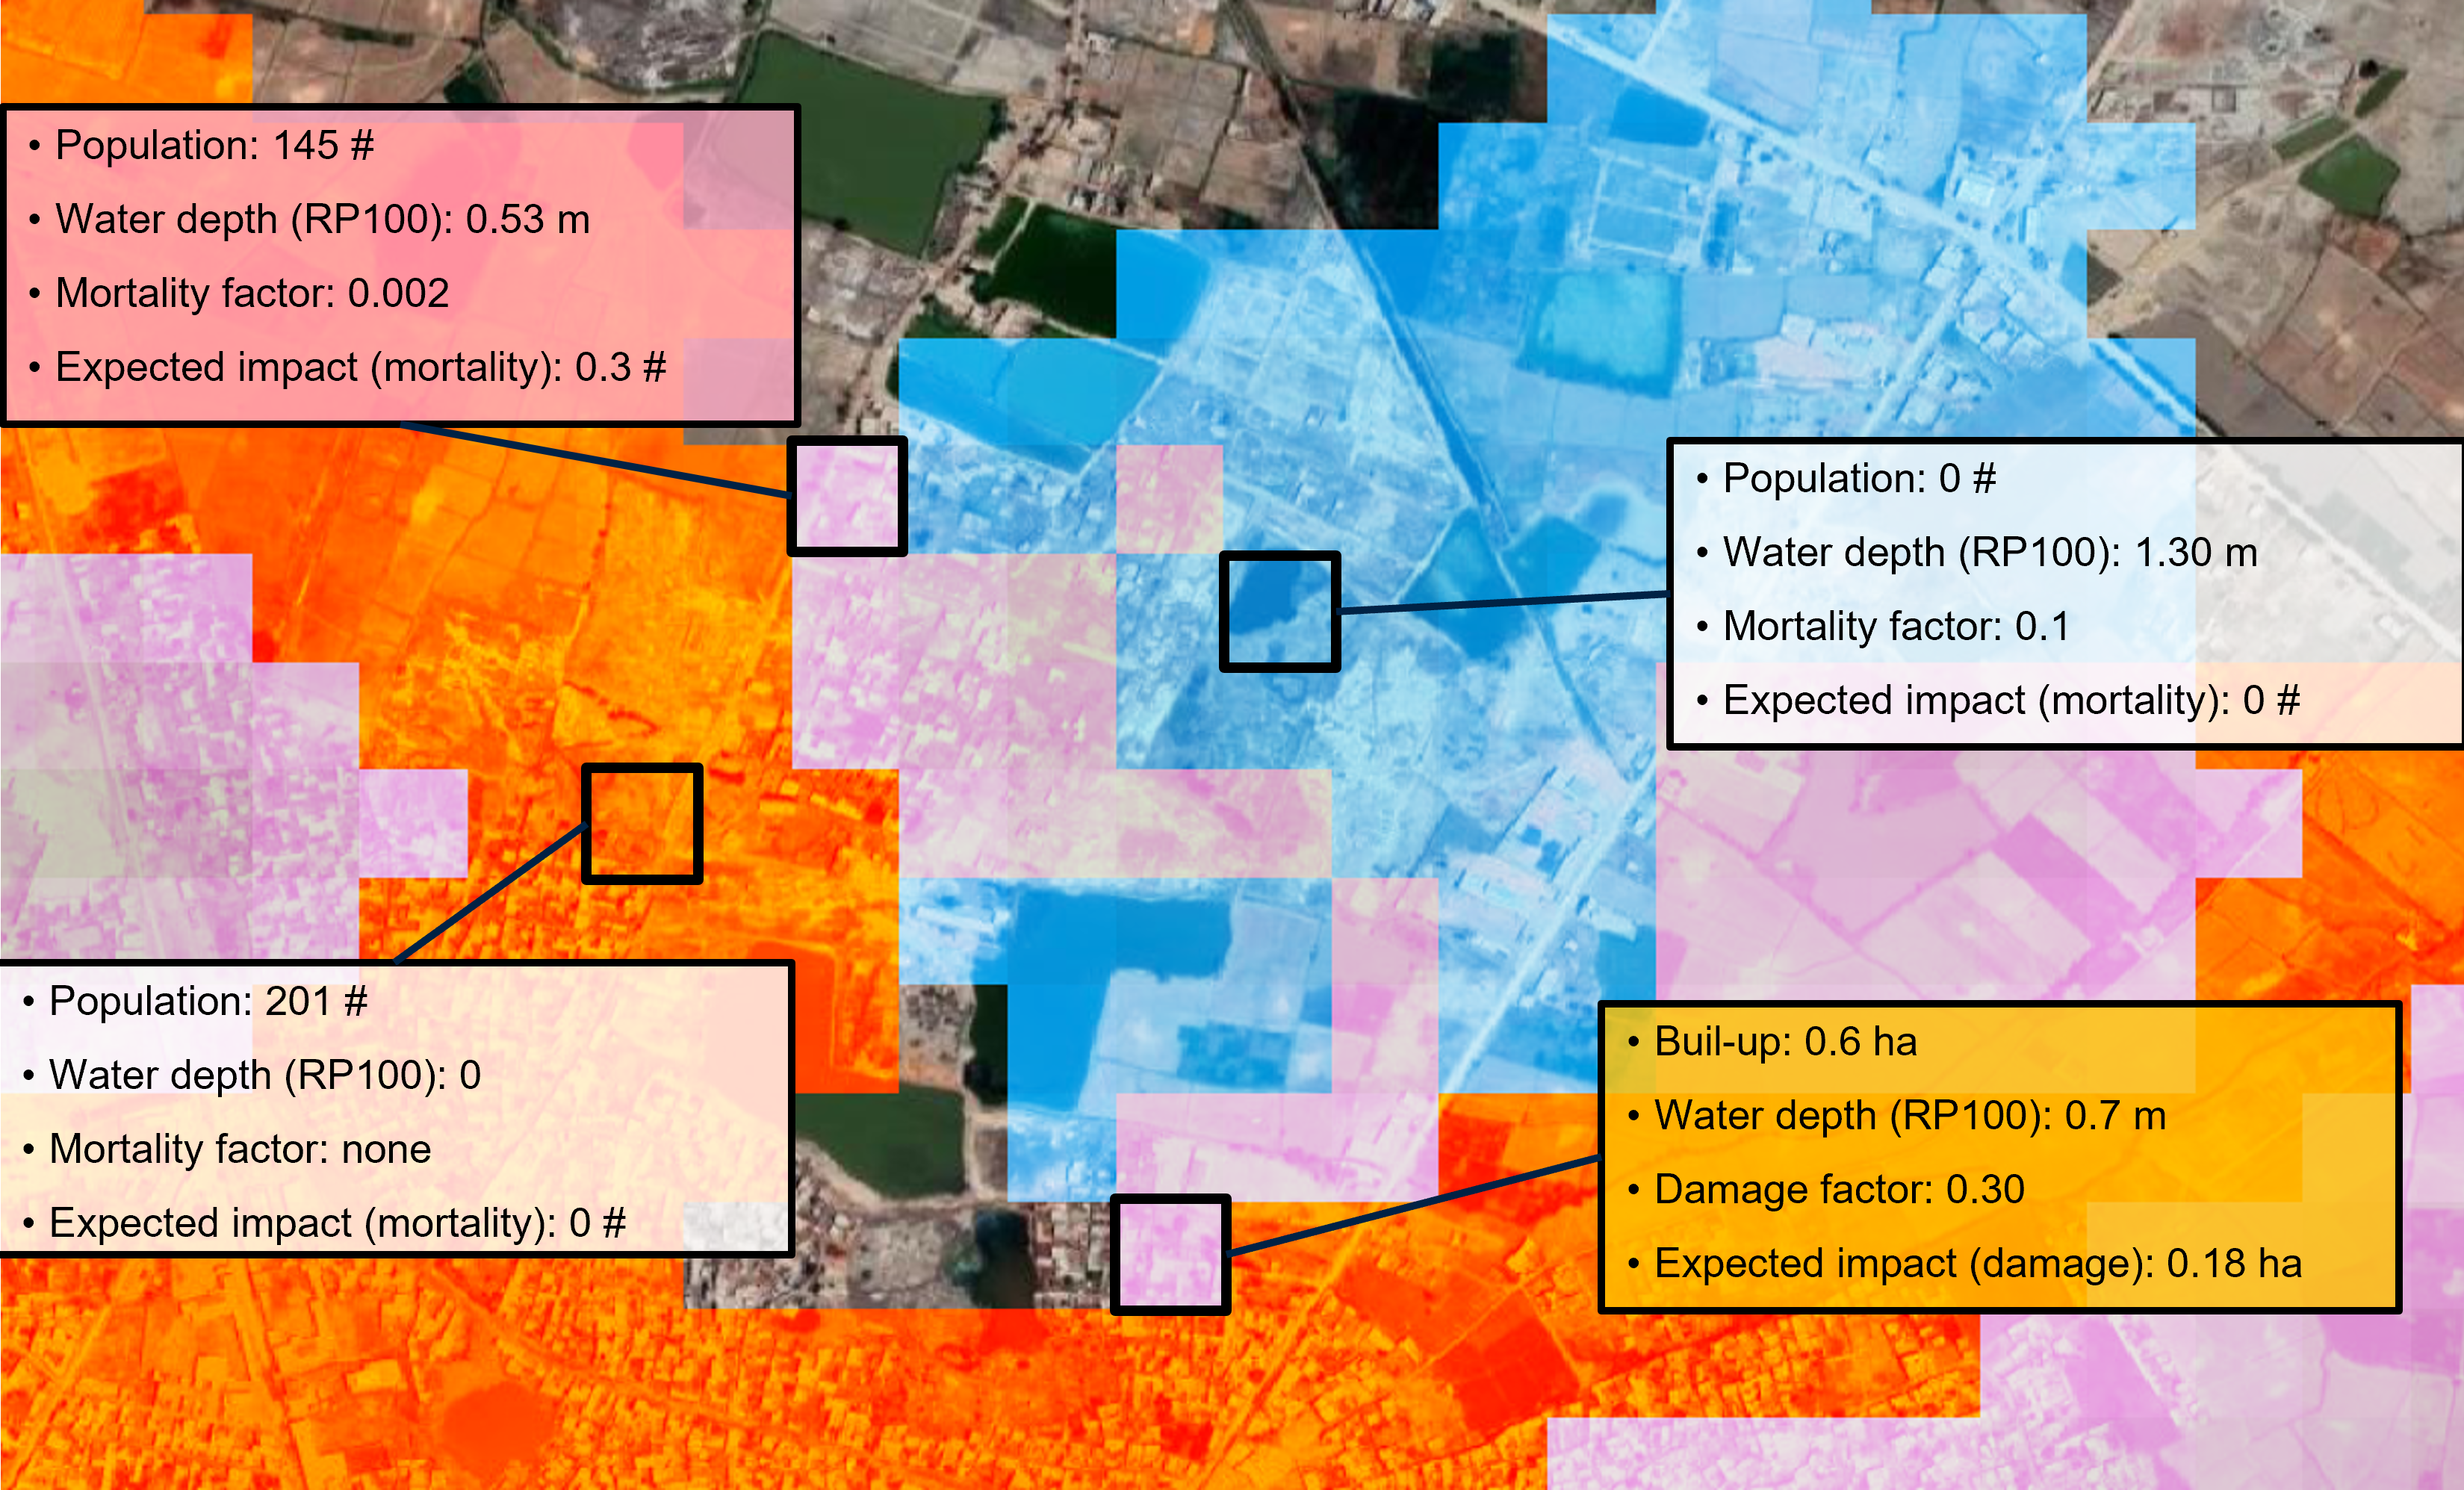
Fig. 7 When a vulnerability model is available for the specific combination of hazard type and exposure category, an impact factor can be applied to obtain a quantitative estimate of impact as a share of total asset value.#
Spatial Risk Calculation#
The complete spatial risk assessment follows the established framework:
Risk = Hazard × Exposure × Vulnerability
In practice, this translates to:
Hazard intensity at each location (e.g., flood depth, wind speed)
Exposed asset value or population count at that location
Vulnerability coefficient representing the expected damage ratio for the given hazard intensity and asset type
This spatial approach enables:
Hotspot identification: Pinpointing areas of highest risk concentration
Scenario analysis: Comparing impacts across different hazard scenarios
Resource prioritization: Informing where risk reduction measures would be most effective
Economic assessment: Quantifying potential losses for insurance and planning purposes
The resulting risk maps provide decision-makers with spatially explicit information essential for disaster risk management, land use planning, and emergency preparedness strategies.
An indicator of mean annual risk: Expected Annual Impact#
When probabilistic hazard scenarios (multiple layers by Return Period) are available to calculate impacts in relation to occurrence frequency, an estimate of the Expected Annual Impact (EAI) over exposed categories can be calculated. This can be done for both the Baseline, refering to the historical period, and for future climate projections.
The EAI is calculated by multiplying the impact from each scenario with its exceedance probability, and then summing up to obtain the mean annual risk considering the whole range of hazard occurrence probabilities. The exceedance frequency curve highlights the relationship between the return period of each hazard and the estimated impact: the area below the curve represents the total annual damage considering all individual scenario probabilities.
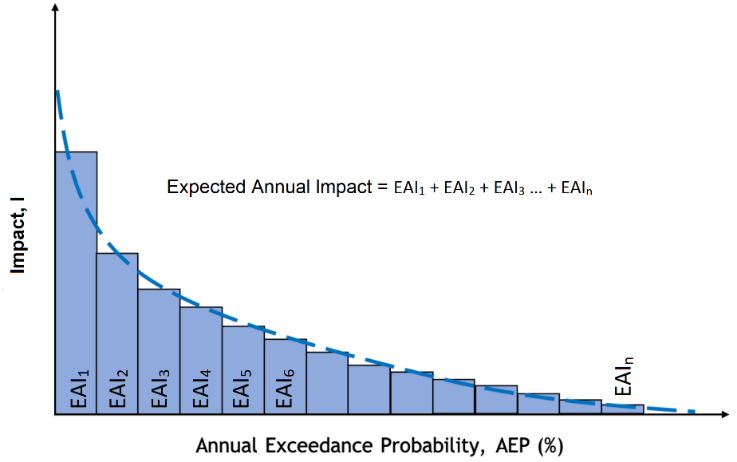
Fig. 8 The Exceedance probability curve integrates individual probability scenarios into one metric: mean Expected Annual Impact.#
In lack of a proper vulnerability function, the EAE is calculated in a similar fashon considering exposure to specific hazard thresholds instead of impacts. (EAE) is then expressed as annual exposure to hazard over a certain threshold.
See also
The calculation of EAI is performed using the customary approach, as exemplified here and here.
Lower and Upper bounds#
Due to requests from regional teams, a refined calculation of the integral for probabilistic EAI and EAE includes:
EAI Lower Bound (EAI_LB): calculated as the sum of the area of recangles built below the exceedance probability curve
EAI Upper Bound (EAI_UB): calculated as the sum of the area of recangles built above the exceedance probability curve
EAI: mean between lower and upper bound
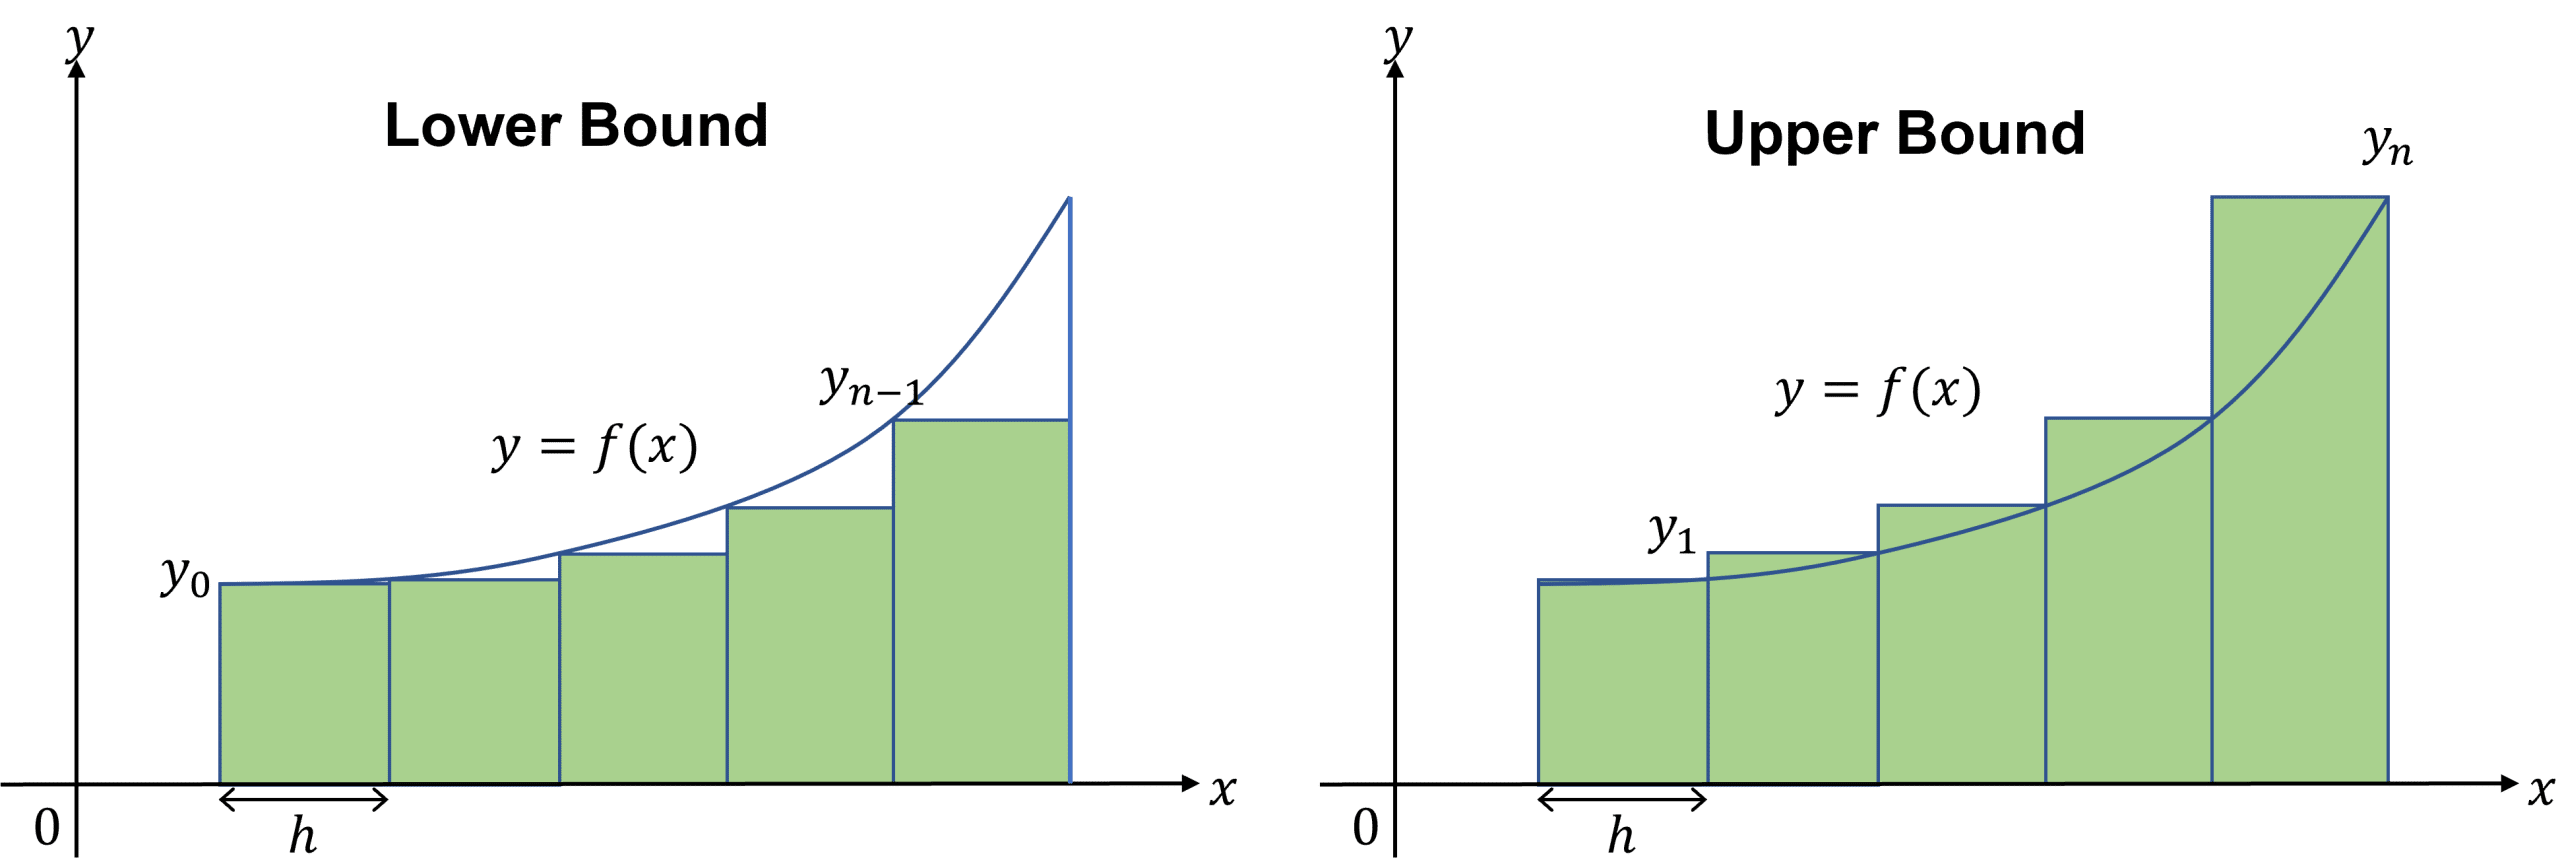
Fig. 9 The integral below the curve is calculated as the mean of lower and upper bound rectangles areas (Riemann sum).#
Supported combinations of hazard and exposure#
Based on the available data, the following matrix show the combinations of hazard and exposure for which a vulnerability model is provided, and the type of model, allowing to express the risk either in form of impact (damage) or exposure to hazard classes.
| Hazard types | Population [Mortality] |
Built-up assets [Physical damage] |
Agricultural land [Production losses] |
|---|---|---|---|
| River and Coastal floods Probabilistic [Water extent and depth] |
Impact model | Impact model | Impact model |
| Landslides Deterministic [Landslide hazard index] |
Exposure by hazard classes |
Exposure by hazard classes |
|
| Tropical cyclones (wind) Probabilistic [Cyclone tracks] |
Impact model | ||
| Agricultural drought Deterministic [Agricultural Stress Index] |
Exposure by hazard classes |
||
| Heat stress Probabilistic [Heat index] |
Exposure by hazard classes |
||
| Air pollution Deterministic [PM2.5 concentration] |
Exposure by hazard classes |