Exposure datasets#
Exposure datasets refer to a variety of datasets that can be used to represent the value that is exposed to suffer damage and losses from natural hazards. This section presents some of the most common and recent type of data and indicators used for this purpose.
See also
Exposure datasets developed by WB disaster risk projects have been placed in a special collection of the WB Development Data Hub: Risk Data Library Collection: EXPOSURE.
Below is a quick link to openly-licensed datasets that are featured in our screening tool.
Name |
Developer |
Metric |
Resolution |
Update frequency |
|---|---|---|---|---|
EU-JRC |
Population count |
100 m |
Annual |
|
DLR |
Presence of built-up |
10 m |
Annual |
|
ESA |
Land cover classes |
10 m |
Annual |
EU-JRC Global Human Settlement Layer#
The Global Human Settlement population model [GHS-POP, Schiavina et al. 2022] offers global population data spatially distributed over built-up land cover. It is similar to WorldPop in terms of approach, but the reliability is generally better, and the errors are contained.
The data is available for different resolutions, from 10 meters to 1 km. In our tools, we use the 100 m dataset. Note that high-resolution population mapping relies on census projections distributed in proportion to built-up density obtained from remote sensing data. This can induce model errors, particularly in mountainous and forest environments, resulting in an overestimation of natural hazard risk in those areas. The dataset is downloaded as regular tiles from the global map.
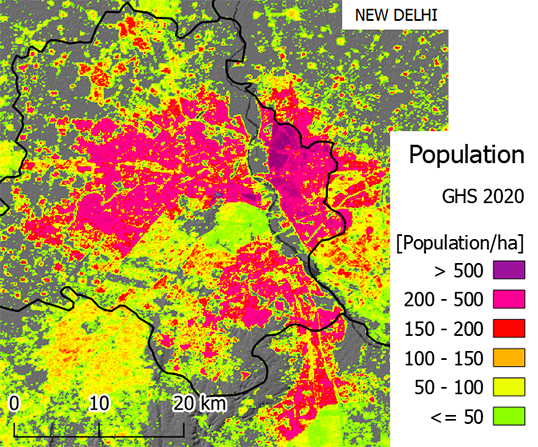
Fig. 19 Population count per 100 m grid over for New Dehli as obtained from EU-JRC GHSL 2020.#
DLR World Settlment Footprint#
Built-up assets include houses, commercial and industrial buildings, infrastructures, facilities, and others. Data from 2019 World Settlement Footprint (WSF) is used for this current analysis. This is a high-resolution (10m) remotely sensed dataset which indicates whether each cell is primarily built up, excluding roads. A script has been developed to automatically fetch WSF 2019 data and resample it at 100m resolution for a selected country. This is included in the toolkit codebase when no exposure dataset is found in the data folder; else you can use this notebook to run it separetely.
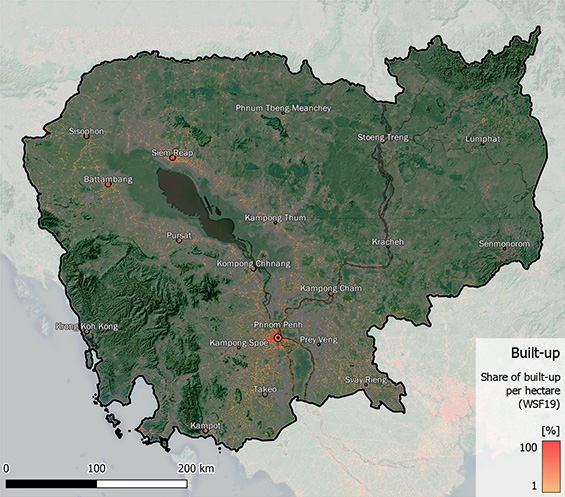
Fig. 20 Built-up land cover information at 10 m resolution for Cambodia as obtained from DLR WSF 2019 and resampled into 100 m built-up density grid.#
ESA World Cover#
The 2020 WorldCover dataset at 10m resolution from the European Space Agency can be used to identify specific types, e.g. agricultural land.
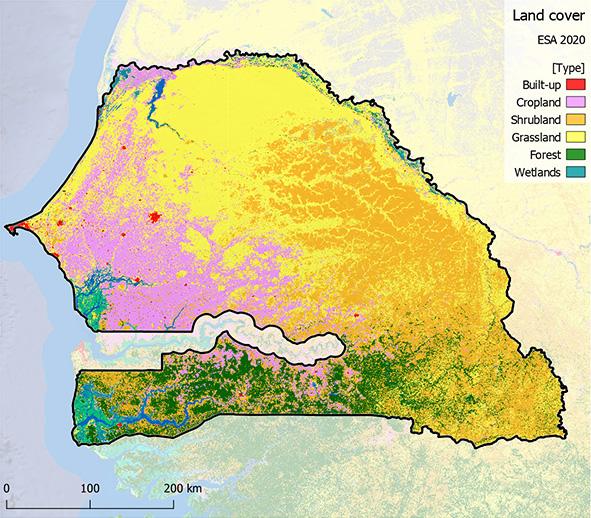
Fig. 21 Land cover information at 10 m resolution over Senegal as obtained from ESA WorldCover 2020.#
Additional datasets#
Additional exposure datasets can be considered.
Name |
Developer |
Metric |
Resolution |
Last update |
|---|---|---|---|---|
Spatially-explicit harmonized global dataset of critical infrastructure |
IVM |
Amount of infrastructure per infrastructure type and Critical Infrastructure Spatial Index (CISI) |
0.1° |
2021 |
FAO |
The GAEZ v4 spatial data cover six themes: (1) Land and Water Resources, (2) Agro-climatic Resources, (3) Agro-climatic Potential Yield, (4) Suitability and Attainable Yield, (5) Actual Yields and Production, and (6) Yield and Production Gaps |
1 km |
2010 |
|
FAO |
Global distributions of cattle, buffaloes, sheep, goats, horses, pigs, chickens and ducks |
10 km |
2015 |