Vulnerability#
The vulnerability of people and asset which are exposed to hazard events determines how likely they are to suffer an impact.
See also
The conditions determined by physical, social, economic and environmental factors or processes which increase the susceptibility of an individual, a community, assets or systems to the impacts of hazards (UNDRR 2019).
For positive factors which increase the ability of people to cope with hazards, see also the definition of coping capacity.
The concept of Vulnerability has a wide interpretation both in the literature and in the risk management practice; this is reflected by the variety of data that could represent it.
Vulnerability data and models#
Two main components of vulnerability are typically accounted for:
Impact models: draw the relationship between the intensity of hazard and the predisposition of damage suffered by specific exposed categories into actual impact. They are called
fragility functionswhen they describe a physical damage (e.g. flood depth/damage functions). Impact models can be quantitative, providing an absolute (i.e. USD) or relative estimate (i.e. ratio of total value) of the damage; or qualitative, classifying the impact in nominal categories.
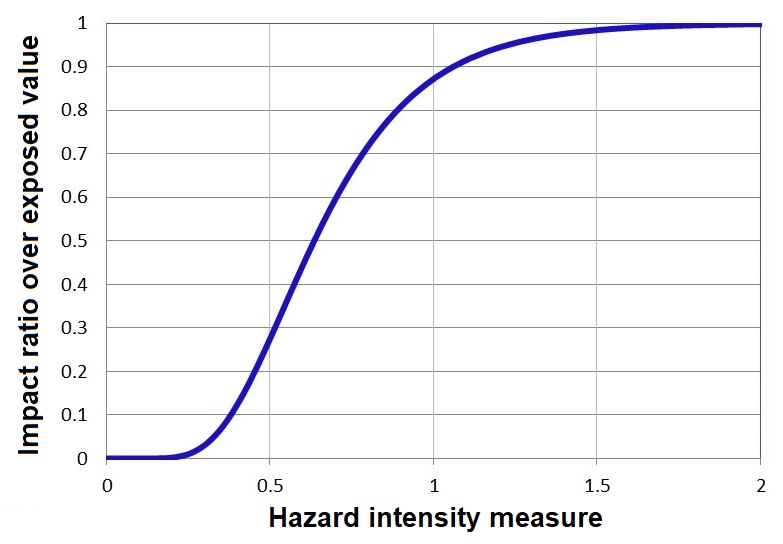
Fig. 2 General example of fragility curve linking hazard intensity measure (x) and probability of loss (or loss ratio) over exposed value (y).#
Note
Not all exposure categories are affected in the same way by physical hazards - some hazards are more relevant for one category than another.
Socio-economic conditions: describe the differential susceptibility of exposed categories to suffer damage, i.e. areas under poverty conditions and high dependency rate are more likely to suffer damage compared to wealthy communities, under the same hazard event. These are measured using spatial indices based on demographics (sex, age composition, dependency rate) and socioeconomic statistics (wealth, GDP and average salary, among others), and are semi-quantitative metrics (index score; ranking).
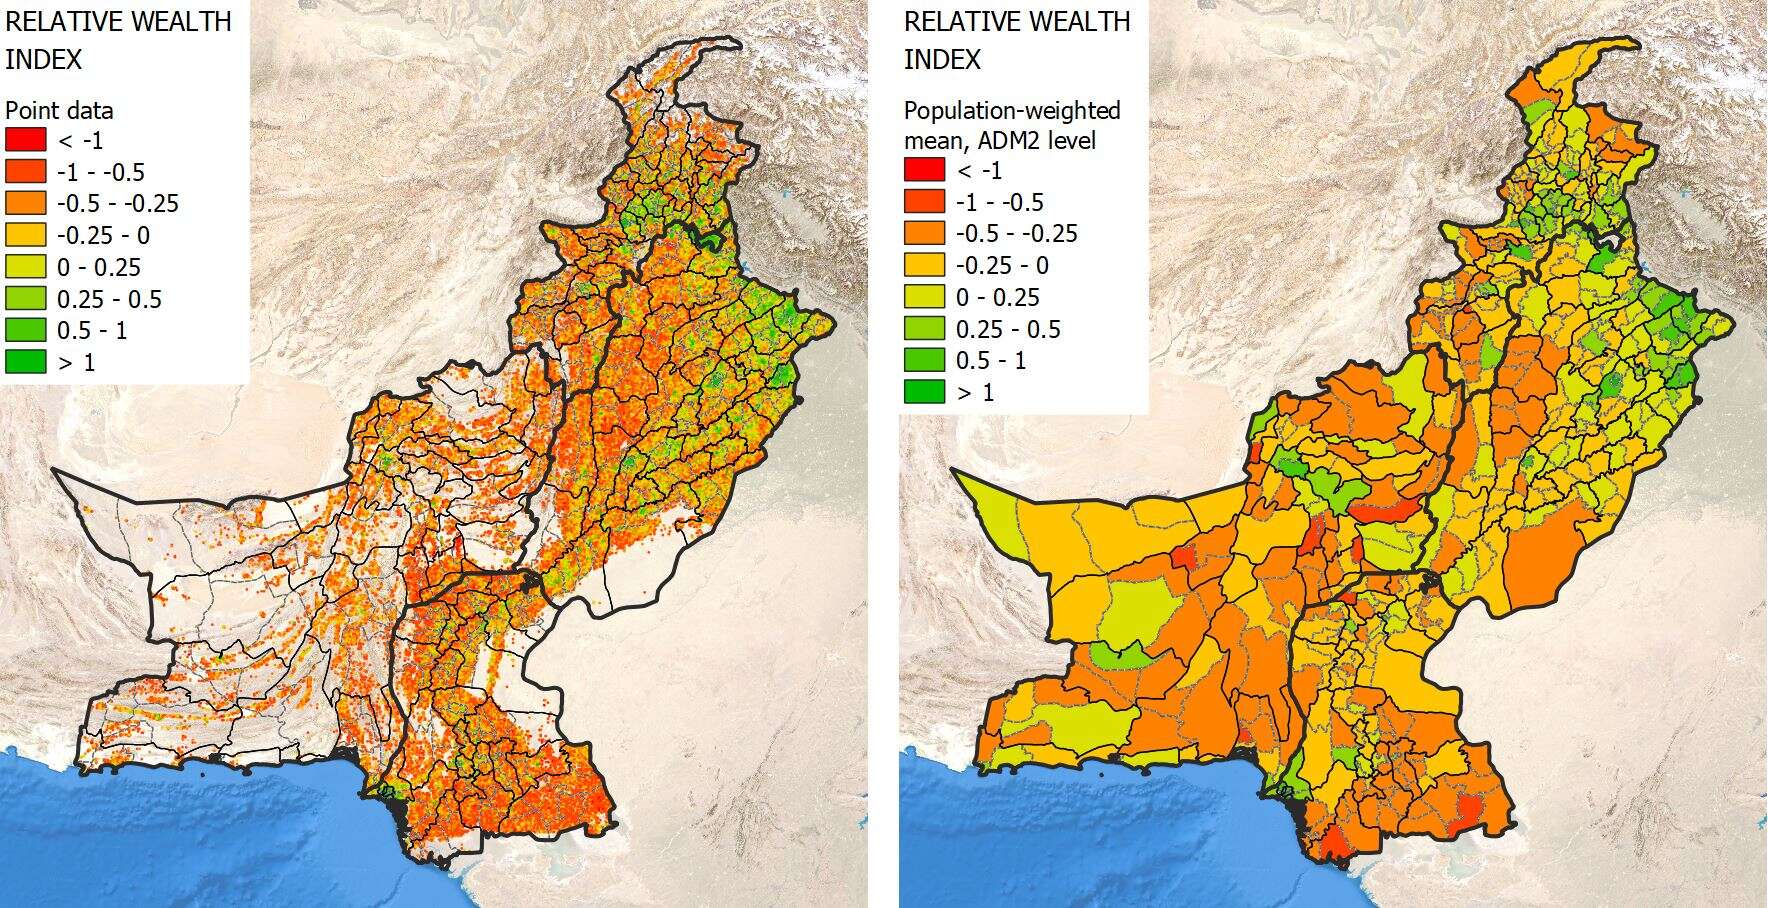
Fig. 3 Example of wealth indicator (Relative Wealth Index) over Pakistan; can be used as proxy to estimate socio-economic vulnerability.#
RWI is one of the options, but a whole range of different proxies can be used to estimate socio-economic vulnerability:
Population density and urbanization rates
Informal settlement prevalence
Age demographics (elderly and child populations)
Education levels
Gender equality indices
Governance stability
When adopting multiple indices, you need to first check for double counting and redundant information. One way to do it is by Principal Component Analysis (PCA), e.g. dropping indicators found with correlation > 0.7. Then, you’ll need a weighting schema to combine these indices together into one score: using equal weights, inverse-correlation weighting, expert opinion, or following IPCC’s guidelines, where Vulnerability is a combination of 1) Sensitivity and 2) Adaptive capacity.

Fig. 4 IPCC AR6 framework of disaster risk: Vulnerability is framed as the combination of Sensitivity and Adaptive Capacity.#
The IPCC AR6 framework decomposes vulnerability into two components:
1. Sensitivity — the degree to which a system or population is adversely affected by climate-related stimuli. Key dimensions include:
Biophysical factors: age, pre-existing health conditions, physical exposure
Socioeconomic factors: poverty, education, access to services
Institutional factors: governance quality, infrastructure access
2. Adaptive Capacity — the ability of a system to adjust to potential damage, take advantage of opportunities, or cope with consequences. Key dimensions include:
Economic resources: wealth, diversified livelihoods, financial safety nets
Technology and infrastructure: healthcare systems, early warning systems
Institutional capacity: governance, disaster preparedness planning
Social capital: community networks, local knowledge, cultural cohesion
The relative weighting of these dimensions should be chosen based on the specific hazard, context, and purpose of the analysis, and should be explicitly justified. There is no single universally prescribed weighting. Common approaches include equal weights, inverse-correlation weighting (to reduce redundancy), or domain-expert elicitation.
Vulnerability models carry limitations related to their applicability. Their quality depend on scale, resolution, model quality, training period and input data quality. As a rule of thumb, their fitness for application in the context of a risk screening or assessment exercise depends on the scale of the risk analysis, i.e. locally-sourced models are expected to be best fitted for local scale assessment (e.g. city level), while global models are best suited for national or sub-national estimates.
In the context of developing countries, however, a global model is often the only available source for a location. In those cases, the application of the global model must be taken with caution and correctly interpreted acknowledging the limitations.