Vulnerability models#
Vulnerability datasets describe the susceptibility of exposed people and assets to suffer damage from hazard events. They translate hazard intensity into expected impact through mathematical functions (damage or mortality curves) or classify exposure into impact categories. Vulnerability data are usually the most difficult piece to collect: not all hazards are described by existing vulnerability studies; and many models are proprietary (e.g. embedded in commercial catastrophe models) rather than open data, and are often not shared as project outputs. This section presents some of the most common and recent models and datasets available.
See also
Vulnerability datasets developed by WB disaster risk projects have been placed in a special collection of the WB Development Data Hub: Risk Data Library Collection: VULNERABILITY.
Below is a quick link to openly-available vulnerability models and data that are used by the CCDR standard screening tool.
Name |
Source |
Hazard type |
Exposure category |
Model type |
Scale |
|---|---|---|---|---|---|
EU-JRC |
Floods |
Built-up |
Damage function |
Regional |
|
Jonkman 2008 |
Floods |
Population |
Mortality function |
Global |
|
Eberenz et al. 2021 |
Tropical cyclone (wind) |
Built-up |
Damage function |
Regional |
|
Zare et al. 2019 |
Heat stress |
Population |
Impact classification |
Global |
|
Burnett et al. 2018 |
Air pollution [PM2.5] |
Population |
Mortality rate |
Global |
|
META |
- |
Population |
Socio-economic |
National |
Flood impact functions#
Damage over built-up: vulnerability functions translating water depth into relative damage (depth-damage curves) have been developed by JRC [Huizinga et al. 2017] based on survey damage data from national studies. The resulting models are calibrated by region (continent) and offer maximum damage values for a variety of exposure types: residential buildings, industrial buildings, commercial buildings, transport, roads and agriculture. This dataset can be used for consistent supra-national scale flood damage assessments, and guide assessment in countries where no damage model is currently available.
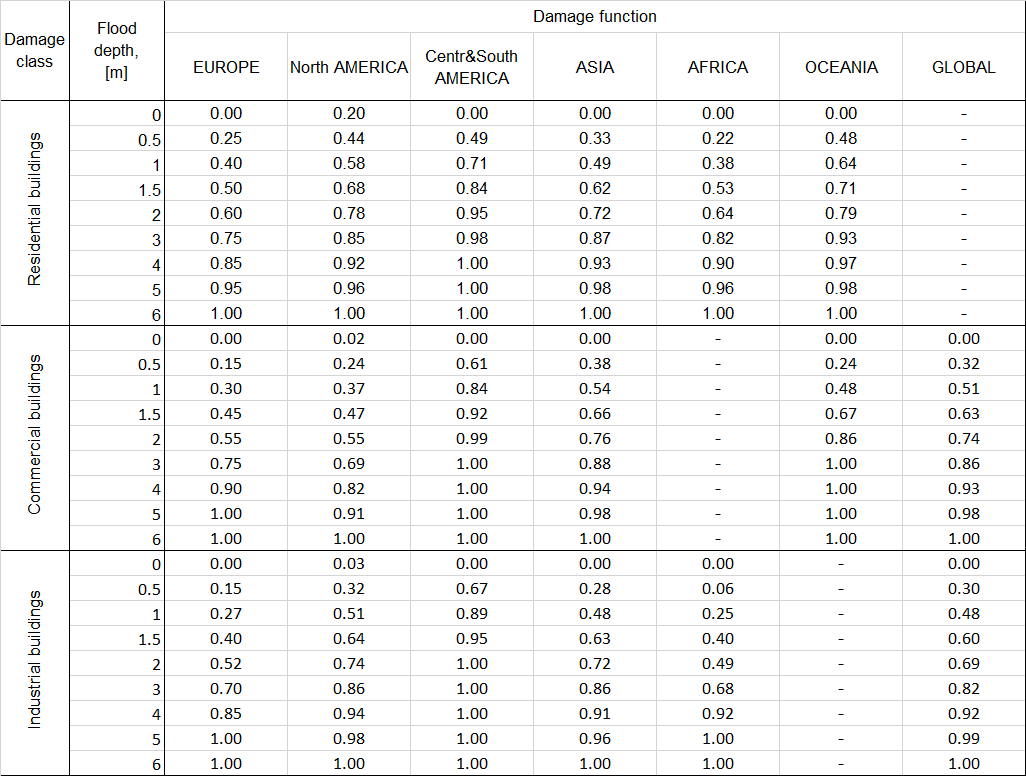
Fig. 22 Depth-Damage function from Huizinga et al. 2017, as excel tables.#
Population mortality: a mathematic relationship between mortality and water depth can be derived from a research study [Jonkman 2008] for locations with rapidly rising water.
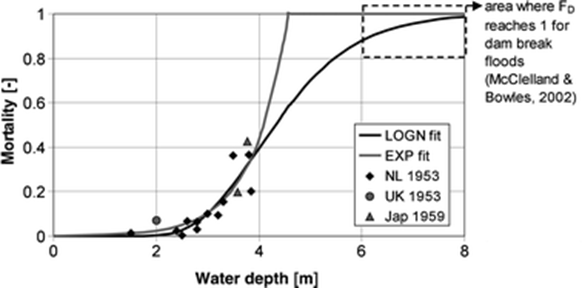
Fig. 23 Depth-Mortality function from Jonkman 2008.#
Wind impact functions#
Damage over built-up: wind intensity is translated into damage over buildings (general) using a mathematical relationship [Emanuel 2011].
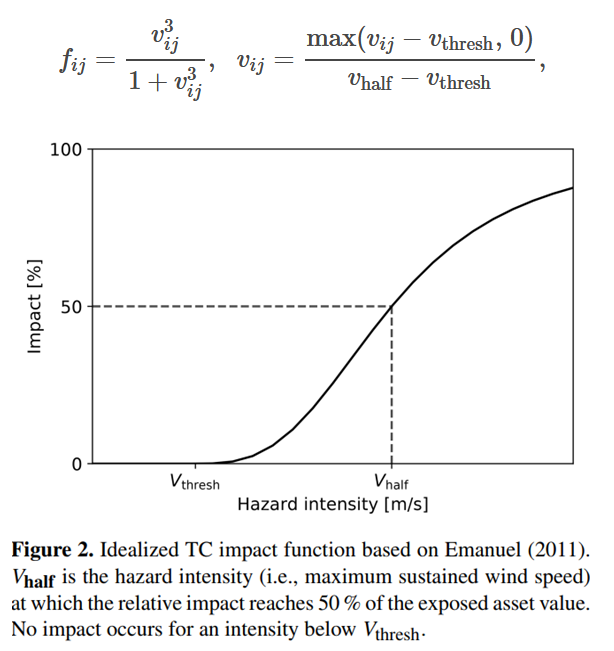
Fig. 24 Cyclone Wind damage function from Emanuel 2011.#
As a further development, regionalised parameters for this function have been developed [Eberenz et al. 2021] for the CLIMADA project.
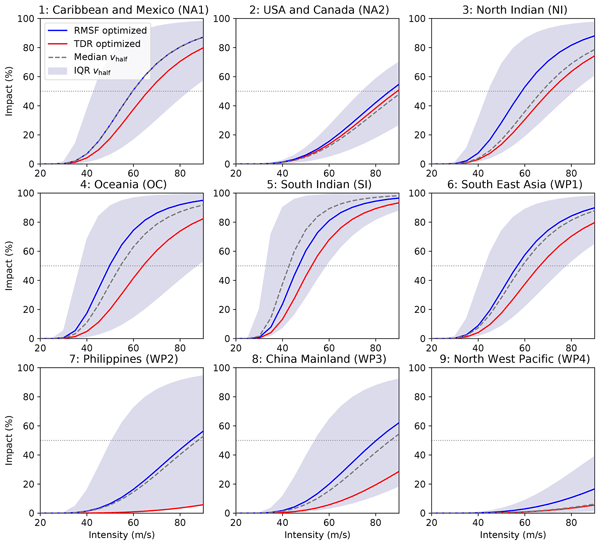
Fig. 25 Cyclone Wind damage function from Eberenz et al. 2021.#
Heat stress classification#
The following table from literature [Zare et al. 2019] provides classification of heat stress over population health according to two common indices, WBGT °C and UTCI °C.
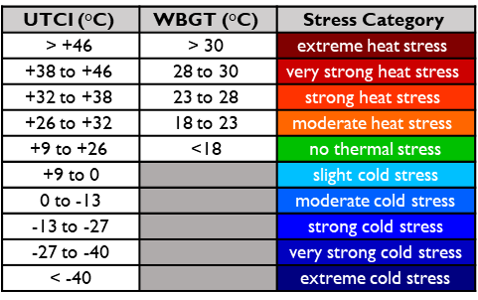
Fig. 26 Heat stress classification according to heat indices.#
Additionally, estimated exposure-response relationships for reduced hourly work capacity (labour productivity) as been proposed based on international standard and epidemiological data [Morabito et al 2021].
Air pollution impact classification#
Life expectancy can be greatly impacted by air pollution, as long-term exposure enhances the risk of cardiovascular and respiratory diseases [Lelieveld et al. 2020]. There are a few studies proposing mortality impact functions from particulate matter. Burnett et al. [2019] proposes a general relationship between PM2.5 concentration and health hazard ratio, as an aggregation of individual health risks.
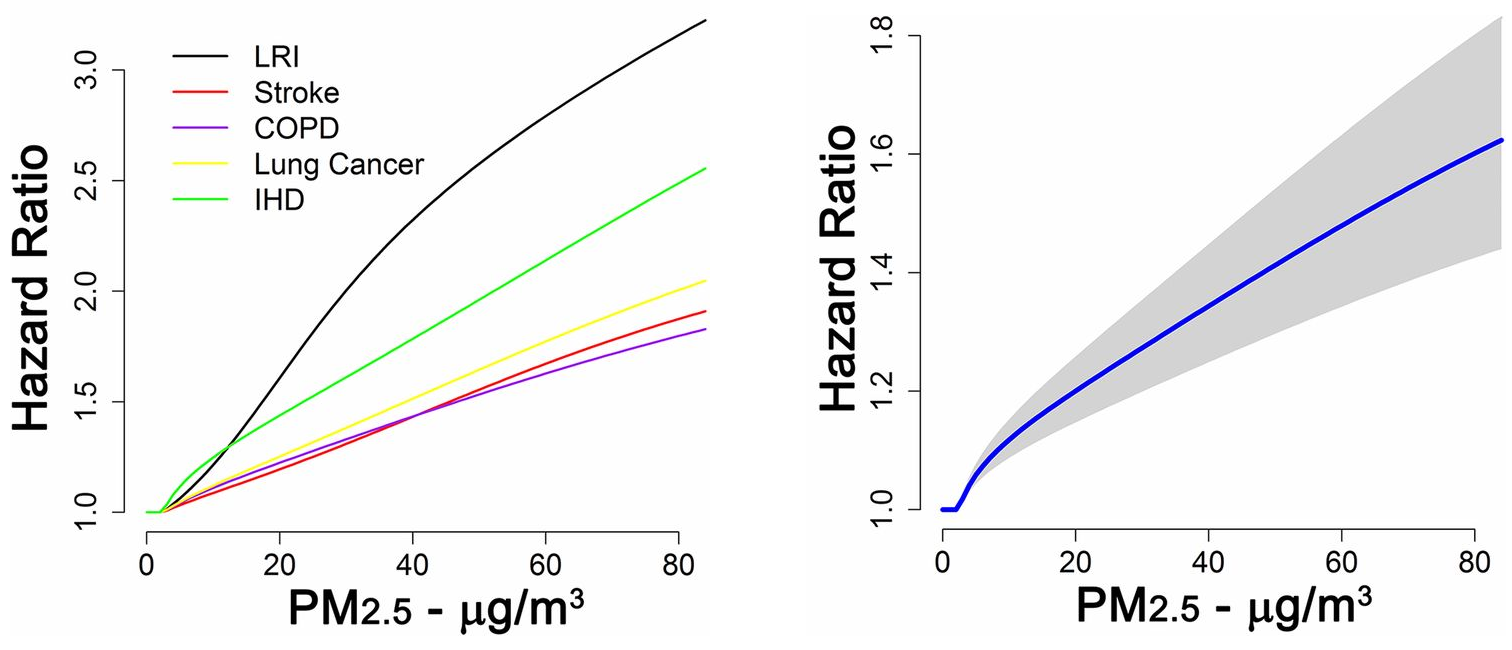
Fig. 27 Air pollution (PM2.5) mortality impact function from Burnett et al. 2018 — health hazard ratio as a function of PM2.5 concentration.#
Additional datasets#
Additional sources of impact models are under review.