Expected Annual Impact (EAI)#
This analytical approach applies to probabilistic hazard scenarios (multiple layers by Return Period) and aims to produce a mean estimate of Expected Annual Impact (EAI) over exposed categories for the historical baseline, as explained in the risk concepts. In order to calculate impacts, we need some probabilistic hazards datasets depticting hazard intensity and aligned physical vulnerability model to translate the intensity into impact over exposed categories. In relation to the global datasets currently available, this is possible for:
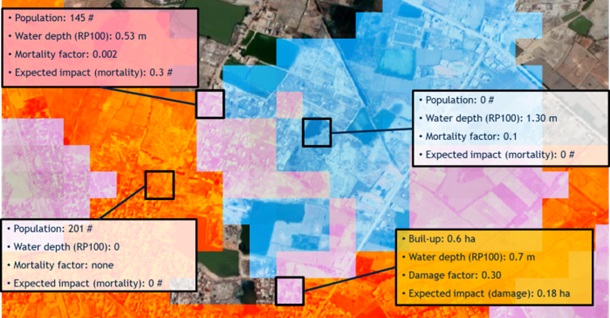
Floods: using water depth as hazard intensity measure, calculates mortality over population and damage over built-up.
Tropical Cyclone - Strong Winds: using wind speed as hazard intensity measure, calculates wind damage over built-up.
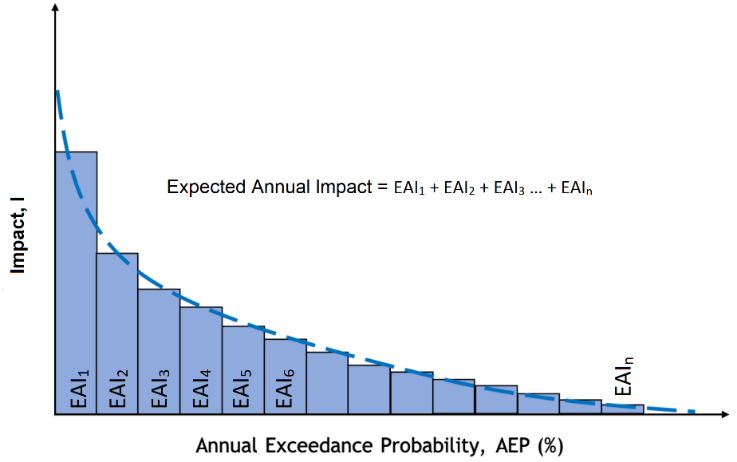
The EAI is calculated by multiplying the impact from each scenario with its exceedance probability, and then summing up to obtain the mean annual risk considering the whole range of hazard occurrence probabilities. The exceedance frequency curve highlights the relationship between the return period of each hazard and the estimated impact: the area below the curve represents the total annual damage considering all individual scenario probabilities.
SCRIPT OVERVIEW#
The notebooks for EAI calculation performs combination of hazard and exposure geodata from global datasets according to user input and settings, and returns a risk score in the form of Expected Annual Impact (EAI) for baseline (reference period).
Note
A developer version (beta) of these scripts makes use of cpu parallelization.
User input is required to define country, exposure layer, and settings. Settings affect how the processing runs (min theshold). The script runs on one country and one hazard at time to keep the calculation time manageable.
The spatial information about hazard and exposure is first combined at the grid level, using the resolution of the exposure layer. E.g. when using GHSL population layer, it is 100x100 meters. The core of the analysis is
raster calculation, combinining exposure and hazard value through an impact function at the grid level.
The exposure and impact estimates are then summarised for the chosen administrative boundary (ADM) level using
zonal statistic. The expected annual impact (EAI) is computed by multiplying the impact value with its exceedence frequency depending on the scenario. Theexceedance frequency curve (EFC)is plotted. These outputs represent the core of the disaster risk historical baseline. The output is exported in form of tables, statistics, charts (excel format) and maps (geopackage).
SETUP THE NOTEBOOK#
As explained in tool setup:
Create environment and folder structure
Move verified input data into the tools folders
Use the interface to select the settings and start the processing
PROCESSING#
LOOP over each hazard RPi layers:#
Filter hazard layer according to settings (min and max thresholds) for each RPi ->
RPi_filteredTransform hazard intensity value into impact factor using specific hazard impact function or table:
RPi_filtered->RP_IFRPi_IF is multiplied with the exposure layer to obtain expected impact:
RPi_IF->RPi_exp_impPerform zonal statistic (SUM) for each ADMi unit over every RPi_exp_imp ->
table [ADMi_NAME;RPi_exp_imp]
e.g.[ADM2_NAME;RP10_exp_imp;RP100_exp_imp;RP1000_exp_imp]
Calculate Expected Annual Impact#
Calculate the exceedance frequency for each RPi ->
RPi_ef = (1/RPi - 1/RPj)wherejis the next RP in the serie. Example using 3 scenarios: RP 10, 100, and 1000 years. Then:RP10_ef = (1/10 - 1/100) = 0.09Multiply impact on exposure for each scenario
(RPi_Exp_imp)with its exceedence frequency(RPi_ef)->RPi_Exp_EAISum all
RPi_exp_EAIcolumns for each ADMi ->table [ADMi;Exp_EAI]RP
Frequency
Exc. frequency
Impact
EAI
10
0.100
0.09
193
17
100
0.010
0.009
1,210
11
1000
0.001
0.001
3,034
3
Total
31
Perform zonal statistic of total exposure within a unit using ADMi ->
[ADMi;ADMi_Exp;Exp_EAI]in order to calculateExp_EAI% = Exp_EAI/ADMi_Exp->[ADMi;ADMi_Exp;Exp_EAI;Exp_EAI%]
Present results#
Plot Exceedance Frequency Curve. Example considering ten RP scenarios:

Plot map of ADMi_EAI and related tables and charts to be included in reports and presentation. You can use open software QGIS to plot the geospatial data (.gpkg).


See also
More details on results presentation.