Climate indices#
The climate component offers an overview of climate indices related to hydro-meteorological hazards based on the most updated information (CMIP6). The related tool provides aggregated statistics at boundary level (country or subnational level) for a selection of:
climate-related hazards
country
time periods
The data can be aggregated:
across time (20 years windows) for representation of spatial distribution at sub-national level (Map output)
ADM1_mean(Ensemble_p50(Period_mean(anomaly/hist_SD)))
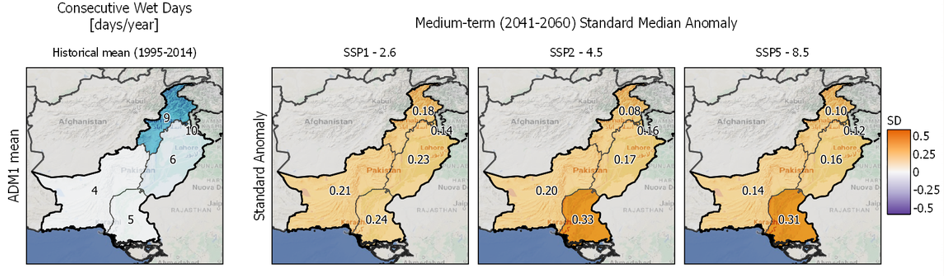
Fig. 40 Example of mean standardardised anomaly (ensemble median) plotted for one climate index over Pakistan, period 2040-2060, 3 SSP scenarios - mean for subnational unit.#
across space (country boundaries) for time-series representation (Chart output)
Ensemble_p10(ADM0_mean(anomaly/hist_SD))
Ensemble_p50(ADM0_mean(anomaly/hist_SD))
Ensemble_p90(ADM0_mean(anomaly/hist_SD))
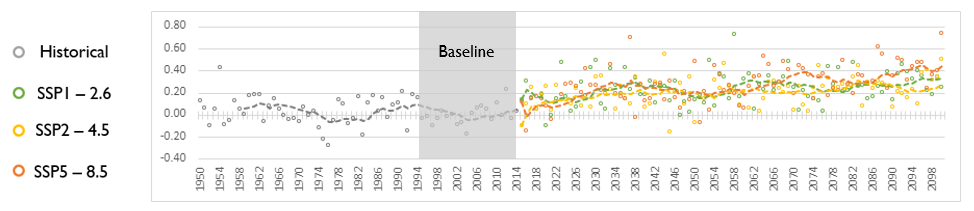
Fig. 41 Example of mean standardardised anomaly (ensemble median) plotted for one climate index over Pakistan, time-series up to 2100, 3 SSP scenarios - mean at country level.#
The table summarises the relevant climate indices and related time scale.
Name |
Description |
Time-scale |
|---|---|---|
R10mm |
Days with rainfall > 10 mm [days] |
Annual |
Rx5day |
Maximum 5-day precipitation [mm] |
Monthly |
R99p |
Extremely wet day precipitation [days] |
Monthly |
CWD |
Consecutive Wet Days [days/month] |
Annual |
CDD |
Consecutive Dry Days [days/month] |
Annual |
slr |
Sea Level Rise [m] |
Annual |
SPEI |
Standard Precipitation-EvapoT Index [-] |
Annual |
Heat |
WBGT or UTCI [°C] - bias adjusted |
Daily |
tmean |
Mean surface temperature [°C] |
Monthly |
Input data#
The climate indices are primarily sourced from the WB Cimate Change Knowledge Portal. Additional indice such as drought indices are obtained from external sources.
Sources of CMIP6 data#
Name |
Developer |
Description |
Data format |
|---|---|---|---|
World Bank |
Large selection of climate indices for both trends and extremes |
Table, geodata, charts |
|
UNDRR |
Full selection of variables, model members, periods |
Geodata |
|
IPCC |
Selection of climate variables for a range of periods and scenario |
Table, geodata, maps, charts |
|
CEDA |
Global high-resolution drought datasets from 1981-2022 |
Geodata |
Dimensions:#
SSP: socio-climatic scenarios SSP1/RCP2.6, SSP2/RCP4.5, SSP3/RCP7.0, SSP5/RCP8
Models ensemble range: percentiles p10, p50, p90
Period: {Historical (1981-2015)}, [Near term (2020-2039), Medium term (2040-2059), Long term (2060-2079), End of century (2080-2099)]
Time scale: Annual (R10mm, CWD, slr, SPEI); Monthly (Rxday, R99p, tmean); Daily (Heat)
Value statistic: {P10, P50, P90, SD}, [P10, P50, P90]
Script setup [WIP]#
Processing#
Runs over one selected country and for a specific set of indices depending on selected hazard
Consider four SSP-RCP scenarios (SSP1-2.6; SSP2-4.5; SSP3-7.0; SSP5-8.5)
Consider four 20-years periods (near term, medium term, long term, end of century)
Calculate median, 10th percentile (p10) and 90th percentile (p90) of standardised anomaly across models in the ensemble (more details)
Plot maps and timeseries
Exported results as multi-tab excel (table) and multi-layer geopackage (vector)