Each map section consists of two key elements: a basemap created using Mapbox and interactions and data operating through CartoDB. Any additions, edits or changes to the data in your CartoDB account will change how the data in these maps almost instantly.
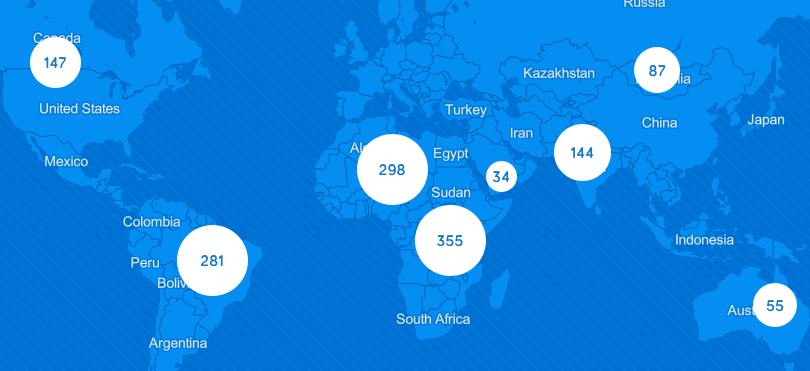
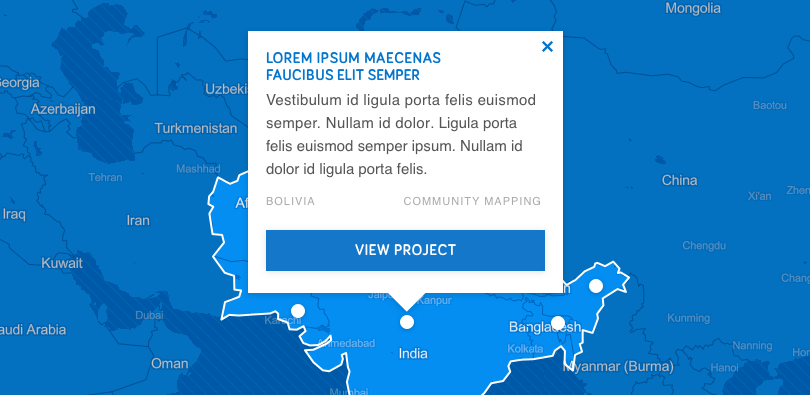
The top image shows datapoints clustered by region, while the image below shows a map where each individual point is visualised. A tooltip, based on the ‘card’ element, described in this guide, is shown in this second image.