ThinkHazard! classifies 11 natural hazards at the scale of local administrative units (ADM2, which can correspond to a county, a district or a province depending on the country) as High, Medium, Low, and Very Low. Hazard levels are then aggregated to ADM1 (region) and ADM0 (country) unit levels, providing a conservative, aggregated view of hazard.
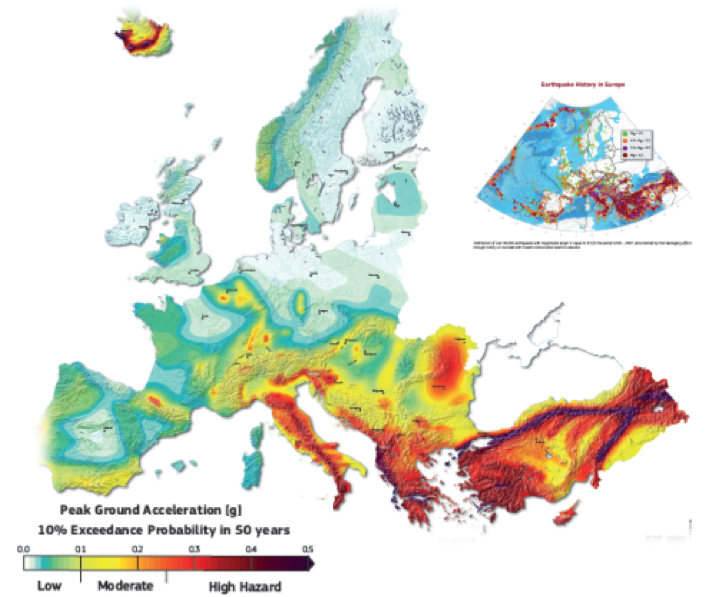
The four hazard levels are derived from hazard maps presenting the spatial distribution of hazard intensity (e.g., flood depth, ground shaking) at a given frequency, or ‘return period’ (e.g., Figure below). A hazard map is the visualization of hazard at one point of a frequency-severity curve; the distribution of hazard intensity varies for each frequency. The timeframe considered in classification of each hazard depends on the timescales over which the hazard causal processes operate, and historical data available to assess long-term averages.
Hazard Levels
Hazard levels can be described as:
High (Score 3): Users should be highly aware of potentially severe damage from this hazard for the project location. Without taking measures to mitigate the hazard and risk, high levels of damage can be expected to occur within the project or human lifetime (and potentially frequently in that timeframe, for hydro-meteorological hazards, e.g., floods, extreme heat).
Medium (Score 2): Users should be aware of potentially damaging effects of this hazard for the project location. Potentially damaging events can be expected to occur within the project or human lifetime and measures to mitigate the hazard and risk should be considered. For hydro-meteorological hazards, damaging effects could occur frequently in that timeframe.
Low (Score 1): Potentially damaging events are less likely to occur within the project or human lifetime but are still possible. Measures to mitigate the hazard and risk would be prudent at critical locations. Hazard has been classified based on long-term averages, and there is still potential that damaging events could occur in this timeframe.
Very Low (Score 0): Available data suggest that potentially damaging effects are unlikely to occur, on average, in the project or human lifetime. Hazard has been classified based on long-term averages, and there is still potential that damaging events could occur in this timeframe.
Not Affected (Score -1): No exposure, below all thresholds, or outside hazard zone.
Geographic Units
ThinkHazard! performs hazard classification at two geographic levels:
Administrative Boundaries
A three-tier administrative hierarchy is used:
ADM2: Local units (county, district, or province depending on country) - primary classification level
ADM1: Regional units (state, region, or first-level subdivision)
ADM0: Country level
Administrative boundary data is obtained from the World Bank Global Administrative Divisions FeatureServer service.
Urban Areas
In addition to administrative boundaries, classification is performed for approximately 3,000 major urban areas globally (largest cities and chief towns). Urban area boundaries are obtained from the GHSL Urban Centre Database (UCDB R2024A), which provides standardized urban extent data based on satellite imagery and population data.
This dual approach ensures comprehensive coverage for both administrative planning contexts and urban-focused development projects.
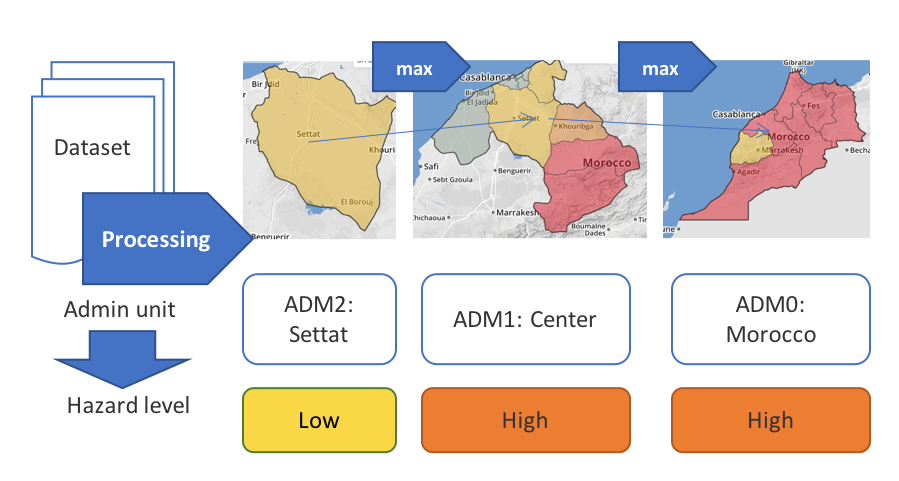
Aggregating Hazard Levels
Hazard classification is conducted at the ADM2 level. The hazard level of higher-level ADM1 or ADM0 units is defined as the maximum hazard level in all lower units that it contains. This aggregation process is intentionally conservative, ensuring that ThinkHazard! shows the maximum hazard in any administrative unit to safeguard against underestimating overall hazard when a large area is selected.
Classification Approach
Probabilistic Data
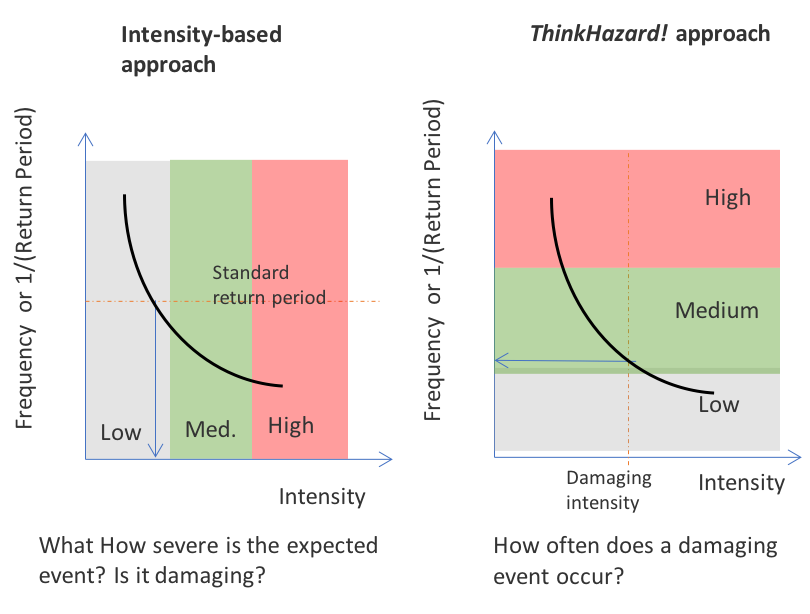
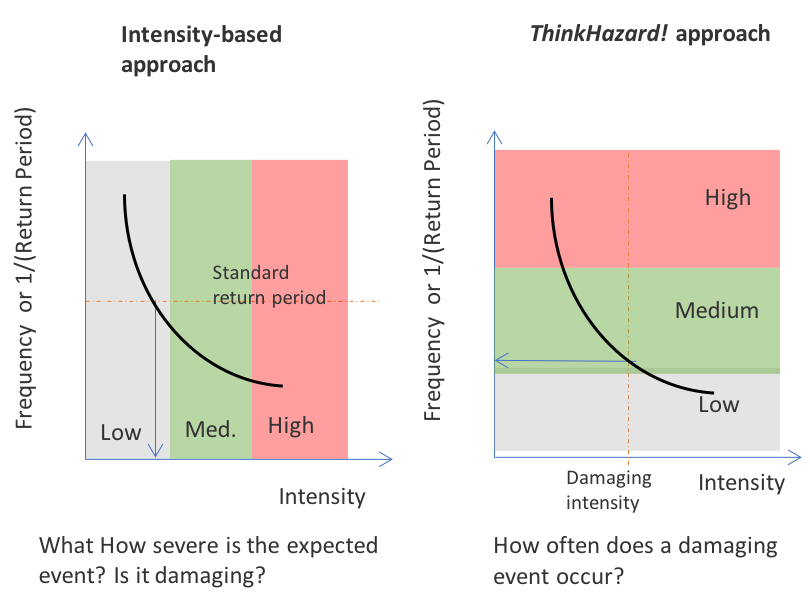
ThinkHazard! uses frequency and severity information to communicate how frequently a project location may sustain damage from a hazard. This is a well-defined process for probabilistic data, which provide both elements required for this assessment (estimates of hazard frequency and severity).
To do this, we first identify an intensity level for each hazard, above which damage is expected to occur, and then assess how frequently that intensity might be exceeded. This information is available on frequency-severity curves, which are a product of probabilistic analysis (see figure below). The chosen formulation helps users prioritize and manage multiple hazards with the greatest chance of causing damage to their interests.
Frequency of a hazard intensity being exceeded can be defined in terms of average recurrence interval, or return period, expressed as ‘1 in 100 years’, or the ‘100-year return period’. Alternatively, this can be expressed as the chance of the intensity value being exceeded on an annual basis: for the 100-year return period hazard this would be 1% chance of exceedance in any given year (1.0% = 1/100); for the 500-year return period this is 0.2% (0.2% = 1/500). Longer return periods correspond to having a smaller chance that the damaging intensity will be exceeded during the reference timeframe lifetime, hence the risk of damage is lower.
Key Parameters
All hazard classification uses two fundamental thresholds:
Value Threshold: Minimum hazard intensity to count pixels as “affected”. This represents the damaging intensity threshold - the intensity above which damage would be expected to occur. Conservative (i.e. low) damage thresholds are used because they are intended to reflect intensity that can cause damage for projects in International Development Association (IDA) countries, in which investments may be more vulnerable.
Area Threshold: Minimum percentage of admin unit that must be affected to trigger scoring. Used by ALL hazards to filter out negligible exposures where only a very small portion of the administrative unit is affected.
Classification by Hazard
Below are the specific classification methods and thresholds for each of the 11 hazards covered by ThinkHazard!.
Earthquake
Data Source: Earthquake (GAR 2017)
Return Periods: RP250, RP475, RP975, RP2475
Intensity Parameter: Peak Ground Acceleration (g)
Intensity Thresholds (RP-specific):
| Return Period | Threshold |
|---|---|
| RP250 | 0.12 g |
| RP475 | 0.10 g |
| RP975 | 0.08 g |
| RP2475 | 0.06 g |
Area Threshold: 5%
Scoring Logic:
| RPs Meeting Threshold | Score | Level |
|---|---|---|
| 0 RPs | -1 | Not Affected |
| 1 RP | 0 | Very Low |
| 2 RPs | 1 | Low |
| 3 RPs | 2 | Medium |
| 4 RPs | 3 | High |
Tropical Cyclone / Strong Winds

Data Source: Tropical Cyclone / Strong Winds (STORM v4, Bloemendaal N. 2023)
Return Periods: RP50, RP100, RP1000, RP10000
Intensity Parameter: Wind Speed (m/s)
Intensity Thresholds (RP-specific):
| Return Period | Threshold |
|---|---|
| RP50 | 36 m/s (~130 km/h) |
| RP100 | 36 m/s (~130 km/h) |
| RP1000 | 30 m/s (~108 km/h) |
| RP10000 | 26 m/s (~94 km/h) |
Area Threshold: 5%
Scoring Logic:
| RPs Meeting Threshold | Score | Level |
|---|---|---|
| 0 RPs | -1 | Not Affected |
| 1 RP | 0 | Very Low |
| 2 RPs | 1 | Low |
| 3 RPs | 2 | Medium |
| 4 RPs | 3 | High |
Floods (River / Pluvial / Coastal)

Data Source: Floods (Fluvial, pluvial, coastal) (Fathom v3)
Return Periods: RP10, RP100, RP500, RP1000
Intensity Parameter: Inundation depth (meters)
Intensity Thresholds: 0.5 m depth
Area Threshold: 5%
Scoring Logic:
| RPs Meeting Threshold | Score | Level |
|---|---|---|
| 0 RPs | -1 | Not Affected |
| 1 RP | 0 | Very Low |
| 2 RPs | 1 | Low |
| 3 RPs | 2 | Medium |
| 4 RPs | 3 | High |
Tsunami

Data Source: Tsunami (GTM network 2017)
Return Periods: RP100, RP500, RP2500
Intensity Parameter: Inundation depth (meters)
Intensity Thresholds (RP-specific):
| Return Period | Threshold |
|---|---|
| RP100 | 2.0 m |
| RP500 | 1.0 m |
| RP2500 | 0.5 m |
Area Threshold: 0% (any inundation counts)
Special Processing: Uses majority (most common) inundation depth per unit rather than mean. The majority value must meet the RP-specific threshold AND the area threshold must be met.
Scoring Logic:
| Condition | Score | Level |
|---|---|---|
| No inundation data | -1 | Not Affected |
| Has data but 0 RPs meet thresholds | 0 | Very Low |
| 1 RP meets thresholds | 1 | Low |
| 2 RPs meet thresholds | 2 | Medium |
| 3 RPs meet thresholds | 3 | High |
Wildfire

Data Source: Wildfire (CEMS 2020)
Return Periods: RP5, RP25, RP50
Intensity Parameter: Fire Weather Index (FWI)
Intensity Threshold: 50 FWI (same across all RPs)
Area Threshold: 20% (higher than most hazards due to spatial characteristics)
Special Check: Area with FWI > 0 must exceed 20% in at least one RP to be considered affected.
Scoring Logic:
| Condition | Score | Level |
|---|---|---|
| Area with FWI > 0 below 20% in ALL RPs | -1 | Not Affected |
| 0 RPs exceed FWI 50 | 0 | Very Low |
| 1 RP exceeds FWI 50 | 1 | Low |
| 2 RPs exceed FWI 50 | 2 | Medium |
| 3 RPs exceed FWI 50 | 3 | High |
Extreme Heat

Data Source: Extreme Heat (GFDRR-VITO 2025) Return Periods: RP5, RP20, RP100 Intensity Parameter: Wet Bulb Globe Temperature (°C)
Intensity Thresholds (RP-specific, hierarchical):
| Return Period | Threshold |
|---|---|
| RP5 | > 32°C WBGT |
| RP20 | > 28°C WBGT |
| RP100 | > 25°C WBGT |
Area Threshold: 30% (reflects that heat affects large areas)
Scoring Logic:
| Qualifying RP | Score | Level |
|---|---|---|
| None qualify | 0 | Very Low |
| RP100 qualifies | 1 | Low |
| RP20 qualifies | 2 | Medium |
| RP5 qualifies | 3 | High |
This prioritizes near-term, likely heat stress over rare events.
Landslides

Data Source: Landslides (UNEP/GIRI 2025)
Data Type: Single categorical index raster with classes 1-5
Intensity Threshold: Not used (area-based only)
Area Threshold: 2%
Scoring Logic:
| Landslide Index | Score | Level |
|---|---|---|
| Index 1 | -1 | Not Affected |
| Index 2 | 0 | Very Low |
| Index 3 | 1 | Low |
| Index 4 | 2 | Medium |
| Index 5 | 3 | High |
Volcanic Eruption

Data Source: Volcanic Eruption (NOAA 2025)
Data Type: Vector polygon data (VEI-proportional buffer zones)
Intensity Threshold: Not used (area-based only)
Area Threshold: 3%
Processing Steps:
Perform spatial intersection with admin units
If no intersection → Score -1 (outside volcano hazard zone)
Calculate intersection area as percentage of admin unit
Find maximum VEI where area ≥ 3%
Remap VEI to score
Scoring Logic:
| VEI Range | Score | Level |
|---|---|---|
| VEI < 2 | -1 | Not Affected |
| VEI 2-3 | 0 | Very Low |
| VEI 3-4 | 1 | Low |
| VEI 4-5 | 2 | Medium |
| VEI > 5 | 3 | High |
Water Scarcity / Drought
Data Source: Water Scarcity / Drought (RWI Baseline Water Stress)
Data Type: Baseline Water Stress (BWS) index [-1, 4]
Intensity Threshold: Not used (direct mapping)
Area Threshold: Not specified (uses aggregated index values)
Scoring Logic: Direct mapping of BWS index values, aggregating the two lowest classes:
| BWS Index | Score | Level |
|---|---|---|
| -1 | -1 | Not Affected (desertic areas) |
| 0 | 0 | Very Low |
| 1 | 0 | Very Low |
| 2 | 1 | Low |
| 3 | 2 | Medium |
| 4 | 3 | High |
Summary Tables
Intensity Parameters and Thresholds
| Hazard | Intensity Parameter | Unit | Value Threshold(s) |
|---|---|---|---|
| Earthquake | Peak Ground Acceleration | g | RP-specific: 0.12, 0.10, 0.08, 0.06 |
| Cyclone | Wind Speed | m/s | RP-specific: 36, 36, 30, 26 |
| River/Pluvial Flood | Inundation Depth | m | 0.5 |
| Coastal Flood | Inundation Depth | m | 0.5 |
| Tsunami | Inundation Depth | m | RP-specific: 2.0, 1.0, 0.5 |
| Wildfire | Fire Weather Index | FWI | 50 |
| Extreme Heat | WBGT Temperature | °C | RP-specific: 32, 28, 25 |
| Landslide | Susceptibility Index | class | Area-based only |
| Volcano | Volcano Explosivity Index | index | Index remap |
| Water Scarcity | Baseline Water Stress | Index | Index remap |
Return Periods Used
| Hazard | Return Periods | Area Threshold |
|---|---|---|
| Earthquake | 250, 475, 975, 2475 years | 5% |
| Cyclone | 50, 100, 1000, 10000 years | 5% |
| Flood | 10, 100, 1000 years | 5% |
| Tsunami | 100, 500, 2500 years | 0% |
| Wildfire | 5, 25, 50 years | 20% |
| Extreme Heat | 5, 20, 100 years | 30% |
| Landslide | N/A (index-based) | 2% |
| Volcano | N/A (vector-based) | 3% |
| Water scarcity | N/A (vector-based) | Majority |
Data Sources
For detailed information about the data sources used for each hazard, please see the Data Sources page.