Introduction
1.1 History of Open Cities and the Open Data for Resilience Initiative
The World Bank, through its Global Facility for Disaster Reduction and Recovery (GFDRR), launched the Open Cities Project in November 2012 to create open data ecosystems that will facilitate innovative, data-driven urban planning and disaster risk management for cities. Open Cities is one component of a broader World Bank and GFDRR program, the Open Data for Resilience Initiative (OpenDRI), further described in box 1.1.
Open Cities is part of the Open Data for Resilience Initiative, sponsored by the World Bank and GFDRR. OpenDRI brings the philosophies and practices of the open data movement to bear on the challenges of building resilience to natural hazards and the impacts of climate change. In partnership with governments, international organizations, and civil society groups, this initiative develops open systems for creating, sharing, and using disaster risk and climate change information to ensure that a wide range of actors can participate in meeting these challenges. Since its launch in 2011, OpenDRI has worked to implement these ideas in over 25 countries around the world.
Since its inception, Open Cities has brought together stakeholders from government, donor agencies, the private sector, universities, and civil society groups to create usable information through community mapping techniques, to build applications and tools that inform decision making, and to develop the networks of trust and social capital necessary for these efforts to become sustainable. This process has been evolutionary, with opportunities for experimentation, learning, failure, and adaptation incorporated into the project planning. This guide discusses the rationale and design of the Open Cities Project, the major components of its implementation to date, and some of the most salient lessons learned from the project so far.
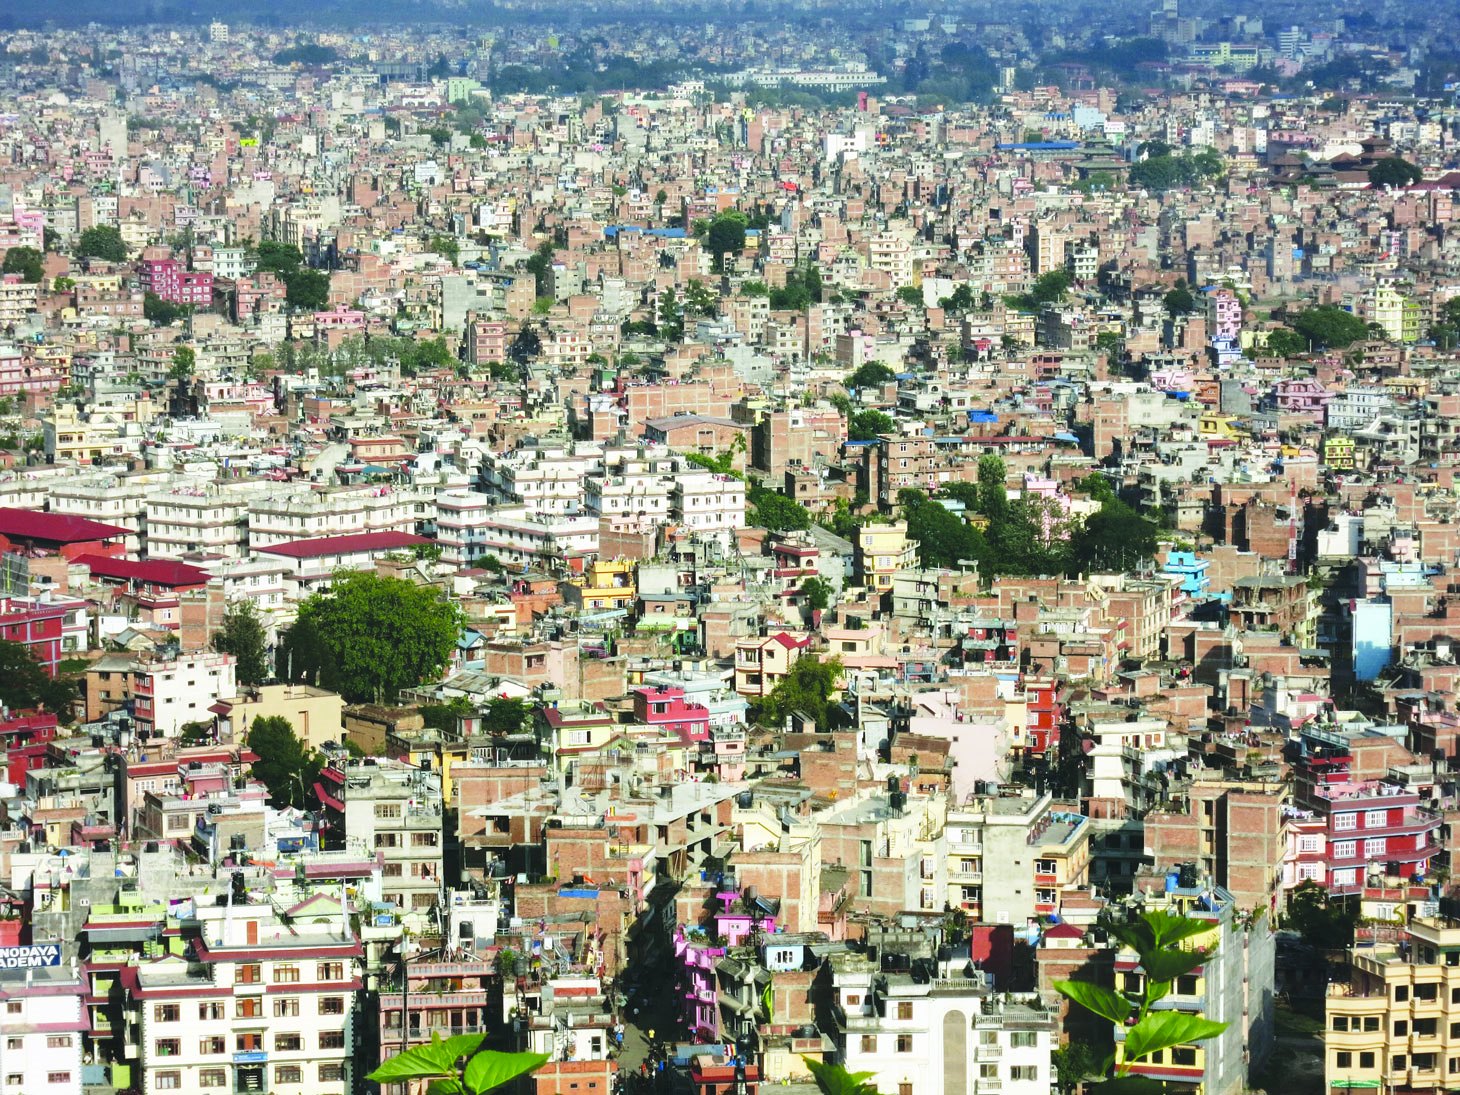
The Open Cities Project launched its efforts in three cities: Batticaloa, Sri Lanka; Dhaka, Bangladesh; and Kathmandu, Nepal. These cities were chosen fo
- Their high levels of disaster risk;
- The presence of World Bank-lending activities related to urban planning and disaster management that would benefit from access to better data; and
- The willingness of government counterparts to participate in and help guide the interventions.
In each of these projects, Open Cities has supported the creation of new data while also attending to the cities' broader ecosystems of open data production and use. To view the city-specific project data collected thus far, visit the Open Cities website (box 1.2).
The Open Cities website provides case studies and visualizations of, and access to, much of the data collected during the first round of Open Cities projects. It was designed and built by our partners at Development Seed and can be accessed at opencitiesproject.org. It will be updated continually as the program expands and more data become available.
Leveraging robust, accurate data to improve urban planning and disaster risk management decisions requires not only high-quality information but also the requisite tools, skills, and willingness to commit to a data-driven decision-making process. With this in mind, Open Cities also has developed partnerships across government ministries, donor agencies, universities, private sector technology groups, and civil society organizations to ensure broad acceptance of the data produced, facilitate data use, and align investments across projects and sectors.
1.2 Rationale for the Open Cities Project
The trend towards urbanization is a global phenomenon. A deep understanding of the built environment is critical to providing relevant services, managing urban growth, and visualizing disaster risk in this context. For example, good characterization of the built environment allows urban planners, engineers, and policy makers to plan for and design appropriate transportation systems and adequate water supply systems; to estimate the population distribution of cities; attempt to manage urban sprawl; and to identify potential sites for parks and public services. In addition, growing populations, unplanned settlements, and unsafe building practices all increase disaster risk.
As urban populations and vulnerability grow, managing urban growth in a way that fosters cities' resilience to natural hazards and the impacts of climate change becomes an ever-greater challenge that requires detailed, up-to-date geographic data of the built environment.
To meet this challenge requires innovative, affordable, precise, open, and dynamic data collection and mapping processes that support management of urban growth and disaster risk. In response to the 2010 earthquake in Haiti, OpenStreetMap pioneered such efforts, as the next section describes.
Open Cities drew from, and was inspired by, a number of projects involving community mapping, primarily the OpenStreetMap (OSM) response to the 2010 Haiti earthquake and the "Community Mapping for Exposure" effort by Australian and Indonesian governments with the Humanitarian OpenStreetMap Team (HOT). Open Cities and the other projects used the OSM platform to harness the power of crowd and community to create accurate, up-to-date spatial data about locations and characteristics of the built and natural environments. OSM is an online database and a global community of over 1 million contributors who collaborate toward building a free and open map of the world to which anyone can contribute and which anyone can use in their own tools and analysis.
Open Cities approaches risk assessment differently from catastrophic-risk-modeling firms, whose data are typically used either for broad awareness raising or for the insurance industry. These professional assessments often involve computationally intensive modeling analysis, but they also tend to rely on statistical representations, proxies, or estimations of the exposed assets, which are expressed in monetary terms. All too often, the data outputs from such assessments tend to be closed, and the collection processes fail to to involve the people living in these areas considered to be at risk.
By contrast, Open Cities engages local expertise and stakeholders in identifying all building structures in an area and assigning vulnerability attributes to each through community mapping and crowdsourcing. In this way, a risk assessment that identifies particular at-risk structures can be completed. An assessment this precise can identify structures based on importance and risk level and therefore can guide plans to reduce disaster and climate risk through physical investment.
Moreover, Open Cities uses detailed information about roads, building infrastructures, and population to help develop land use plans, contingency plans, evacuation routes, and plans for cash transfers to affected vulnerable households in an informed and effective manner. Open Cities thus provides the platform to support activities through the entire disaster risk management cycle. The concept has proven effective and, in fact, can be less expensive to complete than the exposure and vulnerability analyses by typical risk modelers, thanks to the engagement of local experts and stakeholders. In fact, the reliance on local implementers and community mappers, builds local capacity. It also helps to ensure ownership of, and trust in, the data by the local stakeholders and community.
As the data collected become openly accessible, they can be reused, complemented, and enhanced for other applications beyond the initial project, especially in sectors such as energy and transportation where detailed, up-to- date geographic data are required to develop investment programs. As such, having dynamic and detailed data that are freely available to and enhanced by all sectors of the government, development institutions, and private business creates economic value far beyond the project that initiates the data collection. Box 1.3 describes the open license for availability and use of the data in conjunction with the OpenStreetMap platform
The information collected and added to the OpenStreetMap platform is distributed with the Open Database License (ODbL). This means that although individual contributors hold the copyright to the data they produce, the collective data of all contributors are available under this open license. The ODbL allows anyone to freely copy, distribute, and adapt OSM data. The only requirement is that OSM be given credit in any adapted works, and if the original data are altered, the result should be made available under the same license.
In addition to the value of the data's sheer availability, the Open Cities Project's approach of building the capacity of local communities, local and national government, academics, and the private sector creates social and human capital, jobs, support to innovation and new business while ensuring that the overall efforts become sustainable. An integral part of Open Cities as a component of OpenDRI is the development of an ecosystem of data producers and data users through partnerships, capacity building, innovation, and software development-aspects to be further described throughout the guide.
Open Cities has achieved several noteworthy outcomes during its first year:
- Comprehensive and accessible databases of the built environment. For instance, Batticaloa now has a detailed structural database of every building, and Kathmandu has a database of all schools and hospitals to use for risk assessment.
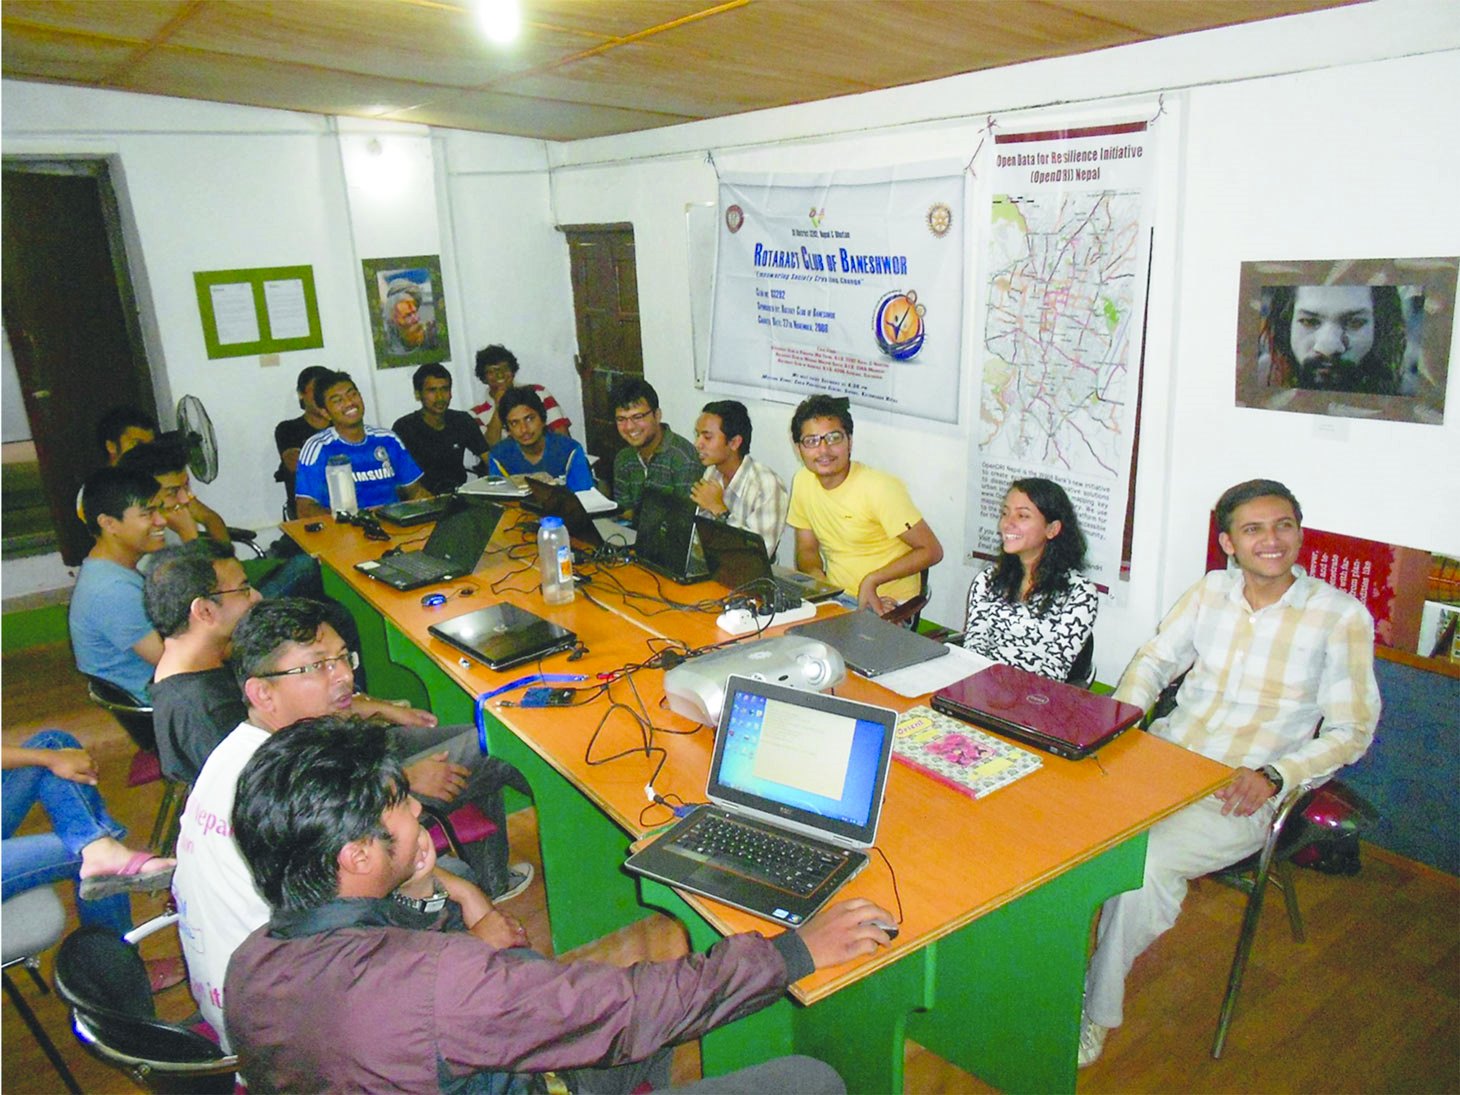
- Improved in-country capacity to update, maintain, and use key datasets. For instance, Kathmandu has created innovation spaces such as the Kathmandu Living Labs, internship opportunities, and university curricula that provide students with employable skills.
- Mainstreamed open-data use and strengthened data collection and management processes at different levels of government. For instance, the Sri Lanka Survey Department asked for support to start incorporating crowdsourcing and community mapping approaches into its regular workflow, and the Government of Sri Lanka sought support for the creation of an Open and Spatial Data Infrastructure.
- Adoption of new applications by multiple levels of government and Bank-financed projects. For instance, forthcoming risk assessments will be driven by detailed data to design physical mitigation investment programs.
- Complementary new partnerships and increased collaboration. New partners to implement projects include the U.S. Department of State, the United States Agency for International Development (USAID), the Humanitarian OpenStreetMap Team (HOT), and the American Red Cross
1.2.1 What is OpenStreetMap?
OSM was first used in disaster response in a large-scale fashion in Haiti, following the January 12, 2010, earthquake. In the days following the disaster, the World Bank, Google, and several other entities made high-resolution imagery of the affected area available to the public. Over 600 individuals from the global OSM community began digitizing the imagery and tracing roads, building footprints, and other infrastructure, creating what quickly became the most detailed map of Port au Prince in existence. OSM's map became the de facto map for the area, and it was used on the global positioning system (GPS) devices of search and rescue teams, to help route supplies around the congested and devastated capital, and to coordinate many other aspects of the response and reconstruction effort. Subsequent work supported by the World Bank, the International Organization for Migration (IOM), USAID, and others would go on to help develop an OSM community in Haiti, ensuring local contributors would continue to shepherd and maintain the resource that international volunteers had created.
The experience of OSM Haiti demonstrated that volunteers who collaborated around open data could quickly create accurate and trusted information. Meanwhile, an OSM project in Indonesia called "Community Mapping for Exposure" has sought to create data - locally and in advance of a disaster - that could inform disaster preparedness and contingency planning activities. Working with local governments, university students, and civil society groups, the mapping work has focused especially on critical infrastructure in the capital region of Jakarta, including schools, hospitals, community centers, and places of worship. The resulting data have been combined with hazard information from a variety of sources to produce realistic impact scenarios using the InaSAFE tool. InaSAFE is an open-source project developed by the Australian Government, the Government of Indonesia, and the World Bank that was created specifically for this work but is now being deployed in other DRM projects. The OSM project has since expanded beyond Jakarta and has mapped over 12.7 million buildings across Indonesia since March 2011.
1.3 How to Use this Guide
This guide offers a comprehensive understanding of the design and implementation of an Open Cities mapping project - for both practitioners in the field and those interested in a higher-level understanding of the process. The guide's content is based on experience in implementing the initial Open Cities projects in Bangladesh, Nepal, and Sri Lanka as well as on more recent projects, such as those in Tanzania, with the group Ramani Huria. It provides relevant examples from those projects in the text and full case studies at the end of guide.
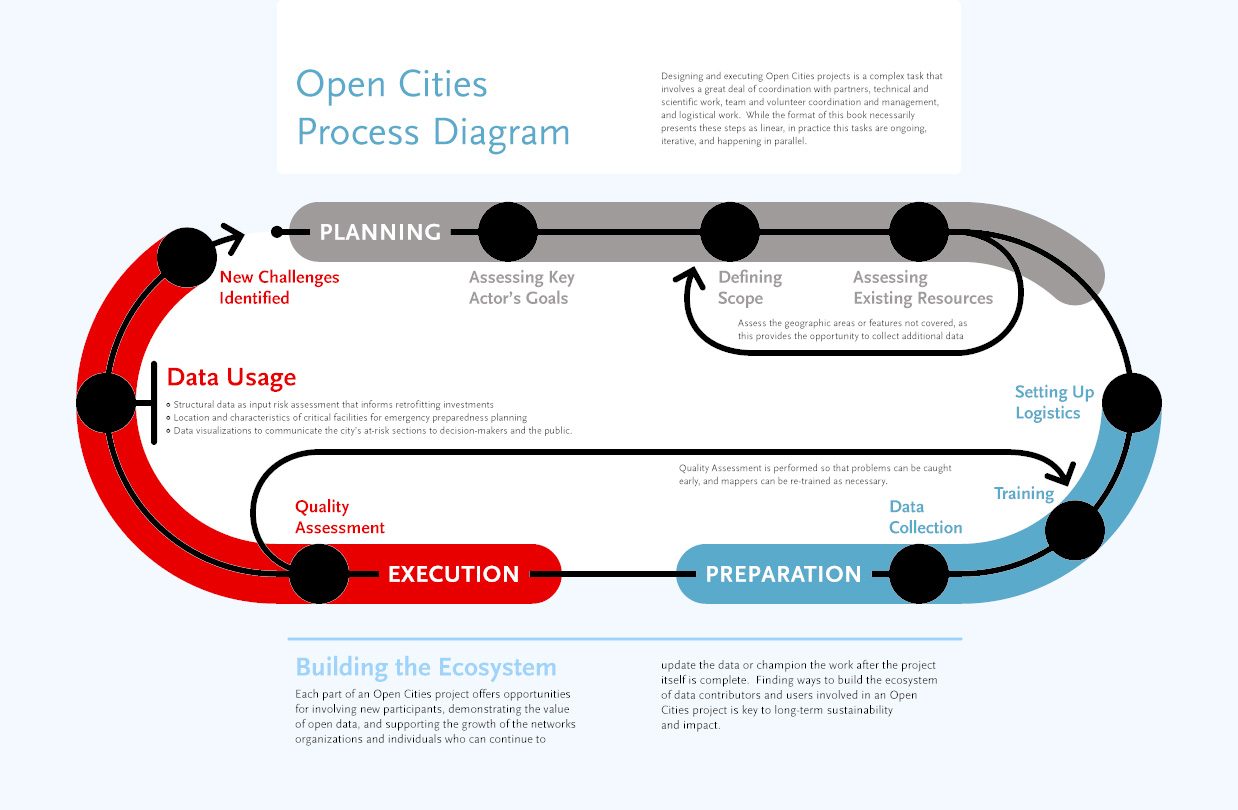
Figure 1.1 depicts the overall process that the chapters will discuss in detail. The next chapter, "Project Design and Preparation", covers how a project design process begins: by identifying partners, clarifying a project's objectives and scope, assembling a team of managers and mappers, and assessing the necessary resources for mapping. Chapter 3, "Getting Started", then describes the steps after the initial planning stage: how to locate an appropriate workspace, assess equipment costs, and prepare staff training. Chapter 4, "Implementation and Supervision", takes a practical look at data collection techniques from both the organizational and technical perspectives. It also addresses common challenges and mechanisms for quality control and reporting. Finally, chapter 5 examines the lessons learned from previous Open Cities projects and considers future improvements to the overall project design.
Project design and preparation
2.1 Key Partnerships
Involvement of a wide community of partners is a central component of an Open Cities mapping project. The OSM community is already built around the idea of collaboration, and its mapping software serves this purpose. Open Cities project data are sourced from and collected by many users and partners and are open and freely available to anyone who wants to use the data. Thus, engaging a community of users and contributors is an important first objective of planning a mapping project.
A good partner...
- Is already undertaking work in a similar context;
- Needs the data being collected in its operation;
- Has a passion for change and an openness to innovation;
- Will benefit from the innovation to improve its workflow;
- Provides contextual knowledge; and
- Shares resources such as workspace, relationships,staff, and supplies.
2.1.1 Why Would Groups Join an Open Cities Project?
All organizations involved in disaster risk management and urban planning (such as local and national governments, international partners, and nongovernmental organizations [NGOs]) need up-to-date, detailed data for their operations. Some of them may already be struggling to maintain their own datasets. By joining with many partners, organizations find it easier to keep data relevant and up-to-date and to avoid reinventing the wheel. The data become more useful and more widely used, their application leading to greater innovation, which in turn encourages further collection of valuable data, which feed back into a robust open data ecosystem.
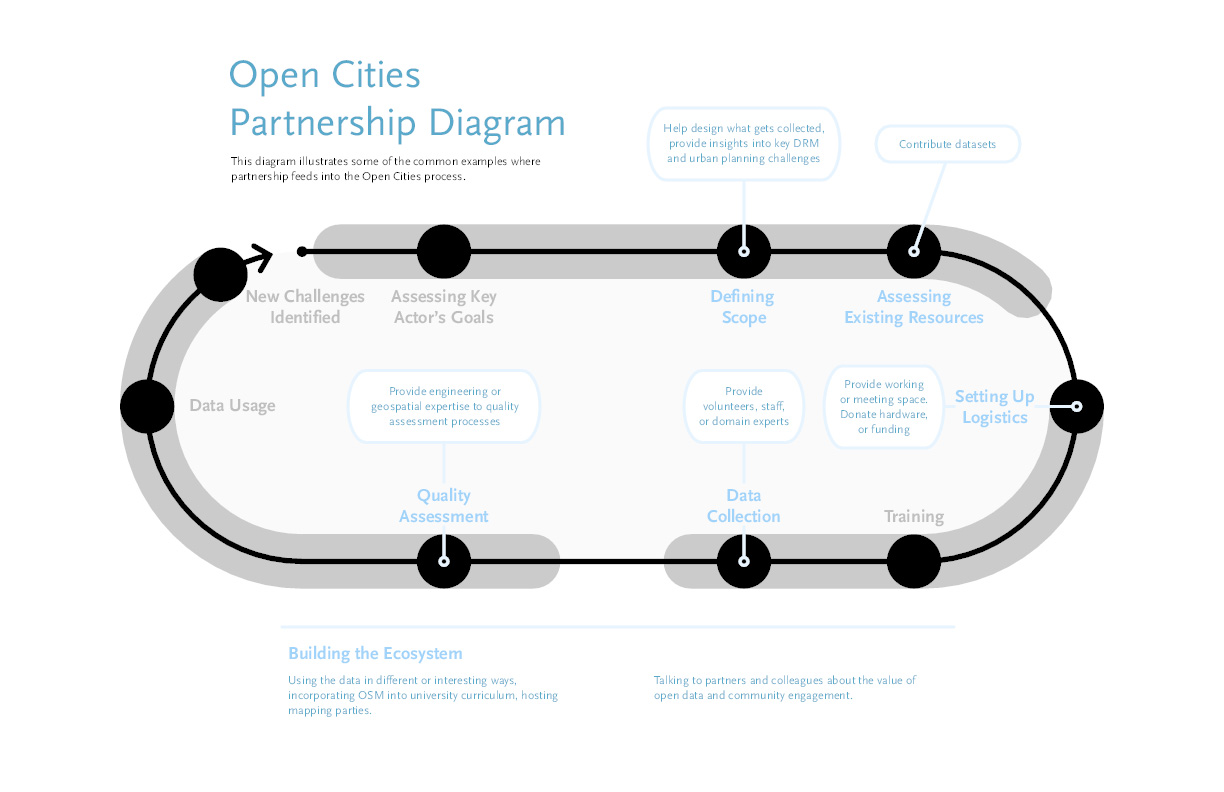
Figure 2.1: Open Cities Partnership Diagram
2.1.2 PARTNER OUTREACH
Government support and participation in an Open Cities mapping project is a key strategy for ensuring its sustainability. The OSM community is also a essential resource, along with other partners such as universities, civil society organizations, and the private sector. This subsection examines these likely partners and their potential roles.
2.1.2.1 Government
In most contexts, governmental support will benefit a mapping initiative because different government units can provide resources and ensure better sustainability and legitimacy of the work. Therefore, they should be included as partners from the early stages of planning.
Government entities will benefit from access to up-to-date, detailed data that they already devote great resources to maintain. In the long-term, government can incorporate the Open Cities data collection methodology into national initiatives by sharing data, experience, and resources. This sort of buy-in will strengthen the project over time. In turn, government support can aid your project in terms of planning, legitimacy, access to existing data, and provision of local resources. Government, particularly the national and local agencies that already work in mapping and geographic data, can provide valuable insight concerning how to plan mapping activities efficiently. Their involvement also adds legitimacy. For example, mappers may face challenges from local people when surveying an area. With the engagement of local government or other authorities, mappers may carry ID cards or letters of approval to demonstrate official support for the project during data collection in the field.
Finally, useful existing data may be found in government storage. Although convincing government bodies to release their data freely to the public can be a challenge (or some data may be private or sensitive), much of the data will be more useful if opened for public access. Furthermore, if the information collected during the project can enhance and build upon government data, the government will benefit through the return of updated datasets. Open Cities can also be an entry point for the government to increase its capacities, update employees’ skills, and start integrating innovative tools and methods into its workflow to reduce costs and improve regular operations. To read more about the place of VGI in government, please visit the following link.
Many different levels and parts of the government can be approached, depending on the focus of the project. When starting a project, identify those agencies that are most important to approach for support. Relevant government departments may cover the following areas:
- Urban development
- Disaster management
- Mapping or surveying
- Census and statistics
- Information and communication technology
- Transportation
- Water and sanitation
- Local government (such as regional and municipal governments, village heads)
2.1.2.2 OpenStreetMap Community
Because Open Cities mapping is built upon the OSM platform, another group to communicate with is the existing OSM community. It is important to understand what the mapping community already looks like and how the Open Cities Project might best support and work with this existing group.
What is the OSM community? Simply put, anyone who actively contributes to OpenStreetMap in a given country or region is part of that community. In active communities, mappers communicate with each other often, plan mapping events, and collaborate on OSM development. In quieter communities, mappers communicate less but contribute for their own personal reasons. Active, vibrant communities are the most productive and sustainable, but no matter what the local OSM user base looks like, there are always possibilities to engage.
Even if direct partnership is not developed with existing OSM contributors, it is important to maintain communication with them and inform them of the project goals and target areas. Since Open Cities mapping will likely take place in an area where others have already mapped, the project must not overwrite the information already entered by volunteer mappers who used local knowledge to edit the map. It is critical that the project participants, as a volunteer community, coordinate any large data imports with the existing community and respects work that has already been accurately completed.
There are several ways to get in touch with OSM mappers:
- E-mail lists, and messaging groups. In many countries, mappers communicate through dedicated e-mail lists. You can find such lists at lists.openstreetmap.org Groups on apps such as WhatsApp or Telegram, are also popular.
- Facebook & Twitter. In many places, the OSM communities have chosen to communicate using Facebook groups, in many cases supplemented with Twitter counts. Therefore, you should search both Facebook and Twitter to find out whether there is a local group for OSM contributors in the areas you plan to map.
- Wiki pages or sites. It is important to check the status of mapping in certain areas by visiting the OSM Wiki site, starting with the main page at http://wiki.openstreetmap.org/wiki/Main_Page. Most countries have at least one dedicated page to the status of the project.
- The “Neis One!” blog. Another useful starting point for connecting with the OSM community is Pascal Neis’s blog at neis-one.org, which provides tools that show which users are actively mapping in certain areas.
- OSM Analytics. OSM Analytics lets us understand mapping activity for defined geographical areas. You can set the geographical area of interest, and the time period of activity.
- HOT Tasking Manager 3.0: The OSM Tasking Manager Platform illustrates ongoing OSM projects that have been established by humanitarian and development agencies - projects that are actively recruiting mapper participation. Project boundaries (indicating what groups are working where, both currently, and in the past) are available, so that new groups can cross check for activity.
2.1.2.3 Other Groups
Other groups may also be considered potential collaborators. Table 2.1 describes several sources of potential partners.
Building partnerships is essential to reaching the higher-level goals of an Open Cities mapping project, such as strengthening the open-source mapping community. Ideally your partners will be directly involved in the planning and implementation of the project. However, if key partners cannot commit time and resources, it is still important to keep them informed about project activities. In this way, you can keep them connected and approach them again later as your project expands.
2.2 Defining the scope of work
The first step of Open Cities project planning is to clearly define the objectives. This means answering questions such as these:
- What is the scale of the project? Has this been done here before?
- What will the data be used for?
- What data will we collect?
- What geographic area will we cover?
- What is the time frame for project completion?
| Universities | Universities and colleges are great potential collaborators. Participation in a mapping project offers students and faculty an opportunity to learn about cutting-edge open-source methodologies, ideas, and software. Students are often technically minded, have flexible time commitments, and enthusiasm to learn new things. Mapping projects that involve academia may also evolve into a permanent part of the university’s curriculum or even a course by itself. Additionally, Open Cities partners that build university capacity in this way help to develop the qualifications of students who can later be hired as interns or staff.
YouthMappers is an international network of student mapping organizations. Chapters meet and map on the OSM platform for development and disaster response objectives. Formed in 2013, through a grant from USAID, the Youthmappers network provides its chapters with training, engagement and research opportunities, all the while advocating for local community level involvement on behalf of its student members. Local YouthMapper chapters are also great potential collaborators, as many are already trained on multiple mapping platforms. |
| Scientific communities | Local scientific communities, whether involved in university research or in civil society organizations, can be called upon to support an Open Cities project in several important ways. First, these are important groups to involve in the data modeling process. Civil engineers, planners, and others have experience with relevant data and analysis, so they may be able to provide suggestions as well as important local context. Second, data quality assessment throughout the project, particularly at the end of the data collection period, is critical, and this group may be well placed to support it. |
| Technical communities | Open-source software communities are often closely linked with OSM communities. Freelance software developers, geographic information system (GIS) specialists, and private software companies may be interested in providing software that assists the project as well as services for the community. These potential partners are increasingly found in start-up, entrepreneurial spaces, such as tech hubs. The technical community also can share its collective professional expertise when hosting a skills workshop, and service providers can rent office space or equipment. For example, the widespread Open Source Geospatial Foundation (OSGeo, at osgeo.org) is closely related to OpenStreetMap. |
| Civil society organizations, organizations, and local NGO’s | Civil society projects may use datasets similar to those of the Open Cities project, and potential partnerships should be explored. The synergies that a collaborating NGO can bring to Open Cities include data sharing and collection, youth outreach, and additional connections to the community. In many communities local Red Cross chapters have been very active mappers, with involvement stemming from both post-disaster response activities and disaster preparedness initiatives. The International Services Division of the American Red Cross has provided in-depth training for national chapters in many countries. |
| International organizations | Many large development projects are funded by international organizations that have significant datasets from previous projects. Their interests focus on a variety of areas and potential synergies may exist. Offices such as the United Nations Office for the Coordination of Humanitarian Affairs (OCHA) often have existing mapping capacity and already have knowledge of the local context and existing data.
Humanitarian OpenStreetMap Team (HOT) was formed in the immediate aftermath of the 2010 earthquake in Haiti. Functioning as both a formal NGO and global community, HOT is dedicated to mapping the most vulnerable places in the world in support of humanitarian aid and sustainable development. HOT organizes mapping training workshops, develops open source tools, and assists organizations and governments with mapping needs for disaster preparedness and socio-economic development. Missing Maps was founded in 2014 as a collaborative effort by American Red Cross, British Red Cross, Humanitarian OpenStreetMap Team, and Médecins Sans Frontières (MSF). Building on lessons learned from the 2010 earthquake in Haiti, Missing Maps is a humanitarian project dedicated to mapping vulnerable areas before disaster occurs. The project recruits remote and local volunteers to produce digital maps of settlements at risk of disease, conflict or disaster. Partners and other humanitarian agencies use mapped data to plan disaster risk reduction and response. |
| Youth and adult community groups | Community groups, by their nature, attract members of society who are interested in volunteering their time for the bene t of the community. A great example comes from Indonesia, where HOT worked with the Scouts to map thousands of buildings in the Bengawan Solo River Valley. |
2.2.1 Overview of the Process
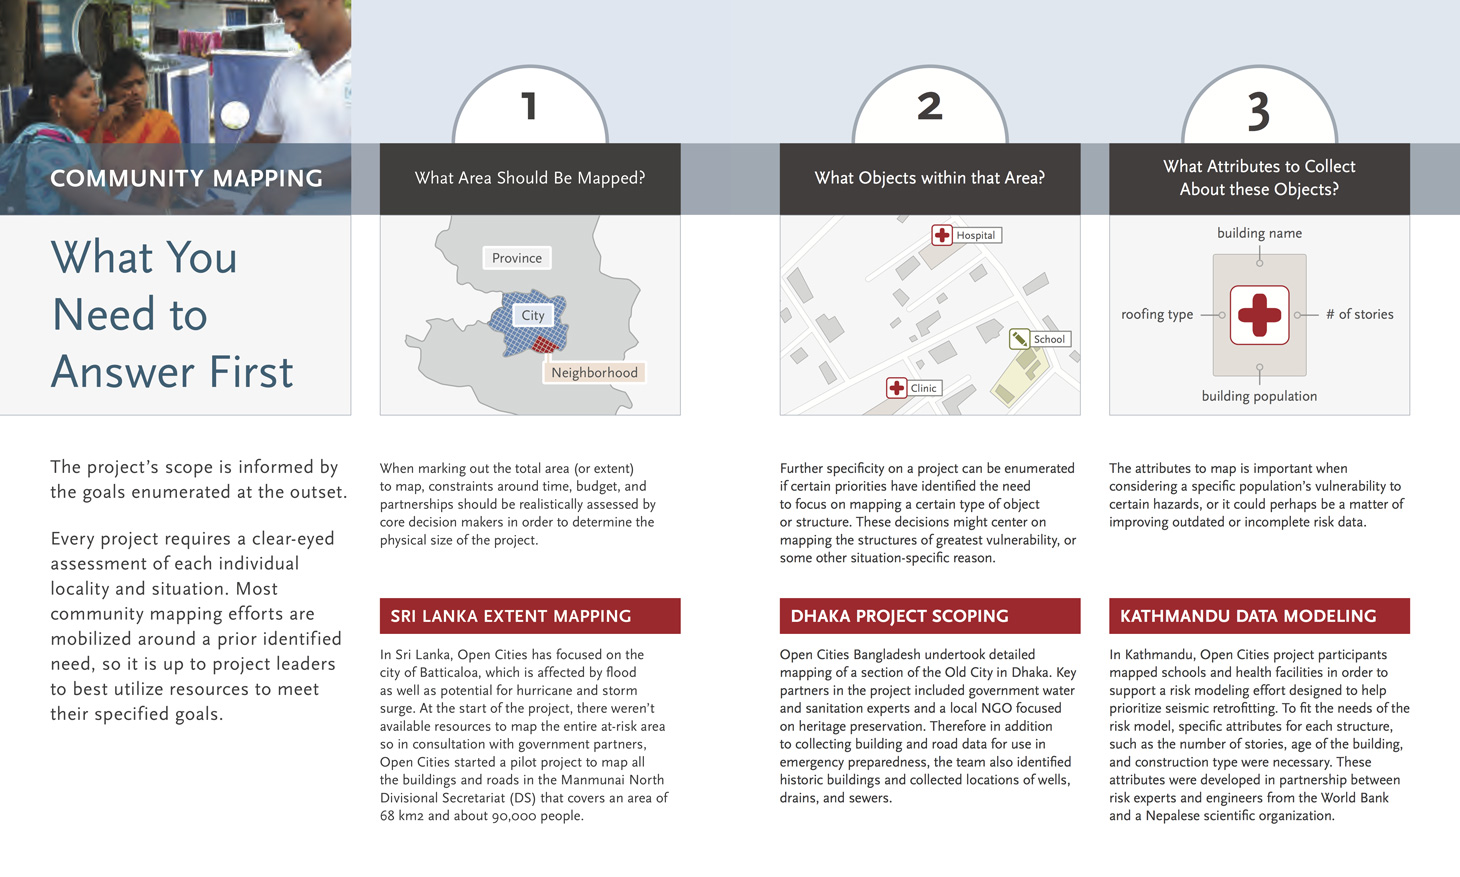
Defining your project’s scope means considering how much area will be mapped, how much data will be collected, and how much time the project will require—a process illustrated in figure 2.2. These decisions will enable you to determine your personnel and resource requirements as well.
Although your long-term objective might be to map a large area such as a city, district, or even a country, it is advisable to begin with a smaller pilot project (box 2.1) and later scale up. This provides the necessary time and experience to build capacity in your team, nurture partnerships, and gain experience in the process.
The following sections will explain how to designate the target area and make rough estimates of the number of features to be mapped. We will discuss what a data model is, how it should be defined, and how to engage partners in this process. Last, we will consider how to manage a project’s time frame and ensure that tasks are completed in proper succession, so that your project effectively meets its deadlines and its goals.
Pilot projects typically map a small part of a much larger area, over a short time frame. The goals of pilot projects are not only to collect data but also to experiment with the surveying methodology and determine the most effective and efficient ways of mapping. Such projects are also useful for demonstrating the effectiveness of innovative mapping tools and strengthening local support.
Figure 2.2: What you need to answer first
2.2.2 Why Are You Collecting the Data?
One of the first questions in designing a project is simply, “What will the data be used for?” In other words, why are you collecting data? You should have a good answer for this at the outset because it will define the sort of data that you want to collect.
For example, Open Cities projects are often oriented toward disaster risk reduction. In the case of disaster preparedness, this might mean collecting data about buildings and other critical infrastructure. For starters, the data would include the location of each building and its geometry (the building’s footprint on the ground), but it also includes information about other building attributes such as the number of levels in the building, the shape of the roof, and the materials used for the walls.
To determine which types of features and attributes the project should map, you will want to consult with the partners involved in the project. For example, you may be working closely with the government’s water and sanitation department—and they might not need buildings’ structural characteristics but will be very interested in using data about drainage lines and solid waste.
One potential challenge is that, with numerous partners wanting different information, you may end up with requests to map many different features along with a wide range of attributes for each. Such a large data model may not be practical to map with the resources at your disposal. Increasing the number of attributes collected has, in previous projects, decreased both the quantity of features mapped as well as the quality of the data. It is therefore important to limit the amount of collected information to only the most important features and attributes. Keeping things as simple as possible will help ensure project success, particularly in pilot projects.
Different structural approaches to mapping offer varying advantages. This guide focuses on the most common approach: systematically mapping an area with an Open Cities project team (usually beginning with desktop mapping, followed up by validation and attribute collection on the ground). But the overall project can be complemented by other activities, , such as by engaging and training volunteers, and hosting events like mapping parties, inviting partners from the community, local university and local governments.
Remember that the more individuals and organizations that are involved in your project, the stronger it becomes. The more participants you have, the more users, contributors, and awareness of the data you will have—which, in turn, strengthens the open data ecosystem for the future. We always recommend engaging a formal project team, due to the formal demands and practical goals of a mapping project, but you are encouraged to combine traditional hiring methods with both volunteer and open training opportunities, as this will engage others in the mapping process, and contribute toward a sustainable local mapping community. It is important to remember that the inclusion of additional individuals and organizations involves logistics and planning that is both time consuming, and not without expense. But, an extended team can help map large areas quickly, and their involvement can create a sense of community and ownership around the project. The project team will have to weight the pro’s and con’s of these kinds of partnerships, and plan accordingly.
2.2.3 Defining the Target Area
You should precisely determine your intended survey area from the start. Are you mapping an entire city? Part of a city? An arbitrary area?
Let’s say that you are mapping a city. You may simply think, “We are mapping City X. That is the area, and it has been defined.” But what does that mean? Does that mean the official government boundaries of City X? Are we interested in the entire urban area or only the city center? If the target area coincides with an existing administrative division, the area will be easy to define, though it might not follow natural roads and features as well as you might like.
Finally, it will benefit you a great deal to know as much as you can about your target area from the beginning. Think about questions such as these:
- How large is the target area in square kilometers?
- How many people live there?
- How many buildings and roads are in the area?
- What will be the main challenges of mapping this area?
2.2.4 Building the Data Model
A data model is a detailed description of all the data you want to collect in your field survey: the features you want to identify and the attributes of those features you want to collect. To a large extent, the data model will relate to the available time and resources for the project—either determining how much you will need or what the constraints might be due to predetermined limits. To complete this data model, determine how much data you will collect, which methods you will use to collect it, and whether privacy or sensitivity concerns will limit what you collect.
Quantity of data. Defining a data model may be easy or it may take some time. If many partners are involved who want to collect many different types of data, deciding on which data to collect could prove to be a challenge. Remember that you may not want your surveyors to collect 100 or even a couple of dozen attributes about every feature on the ground. The more attributes you must collect, the greater the time and resources you will need for data collection.
Collection methods. You will also need to decide whether surveyors will collect only those attributes that are directly observable, or whether they will be required to speak with building occupants. Speaking with building occupants will take considerably longer than surveying simply through observation. This decision will greatly affect the surveyors’ mapping speed and therefore the time frame and cost of the project. Some projects may decide to perform an exhaustive "census" of infrastructure, such as the the buildings or roads, for basic attributes or information about their condition or construction materials. More detailed survey information could be collected from building occupants using a predefined sampling method - so perhaps interview only every 10th house, or, a random sample of houses within the community
Sensitivity of data. Remember also that the data you are collecting will be shared on an open-source database. You will not want to collect data that may be considered private or sensitive.
Figure 2.3 shows part of a sample data model (for a complete sample form, see Appendix 6.1, “Data Design”). It is a good idea to write down the list of features you want to collect and, beneath each feature, to list the attributes you want to collect. For example, one feature you will likely be mapping is roads. Defining the data model for roads means determining which attributes you want to collect, such as the following:
- Type of road
- Name of road (in one or multiple languages)
- Surface types of road (asphalt, concrete, brick, stones, gravel, or unpaved)
- Direction of traffic (one-way, two-way, or variable by time of day)
2.2.5 Estimating a Time Frame
Project duration may not be something you can define from the start, but you should be able to estimate it. Will it take a month? Four to eight months? A year? This will become clearer as you plan your project and consider the logistics (especially when you consider the quality of the existing map data: see next section, 2.3), but you should begin developing an idea of the time required to complete the project.
Be sure to think through the factors that will affect your survey work, and include them when working on your time frame. How much desktop mapping is required before embarking on field data collection? Will major holidays occur during the proposed time period? How many days each week do you expect your staff to work? How many hours per day will they realistically be able to work? Keep in mind considerations such as regular work breaks, time for prayers, time for classes (if the staff will include students), travel time, and so on. Weather can also be a significant factor in the ability to conduct field work (rainy season, heat wave). Allow a time buffer in the collection timetable for this.
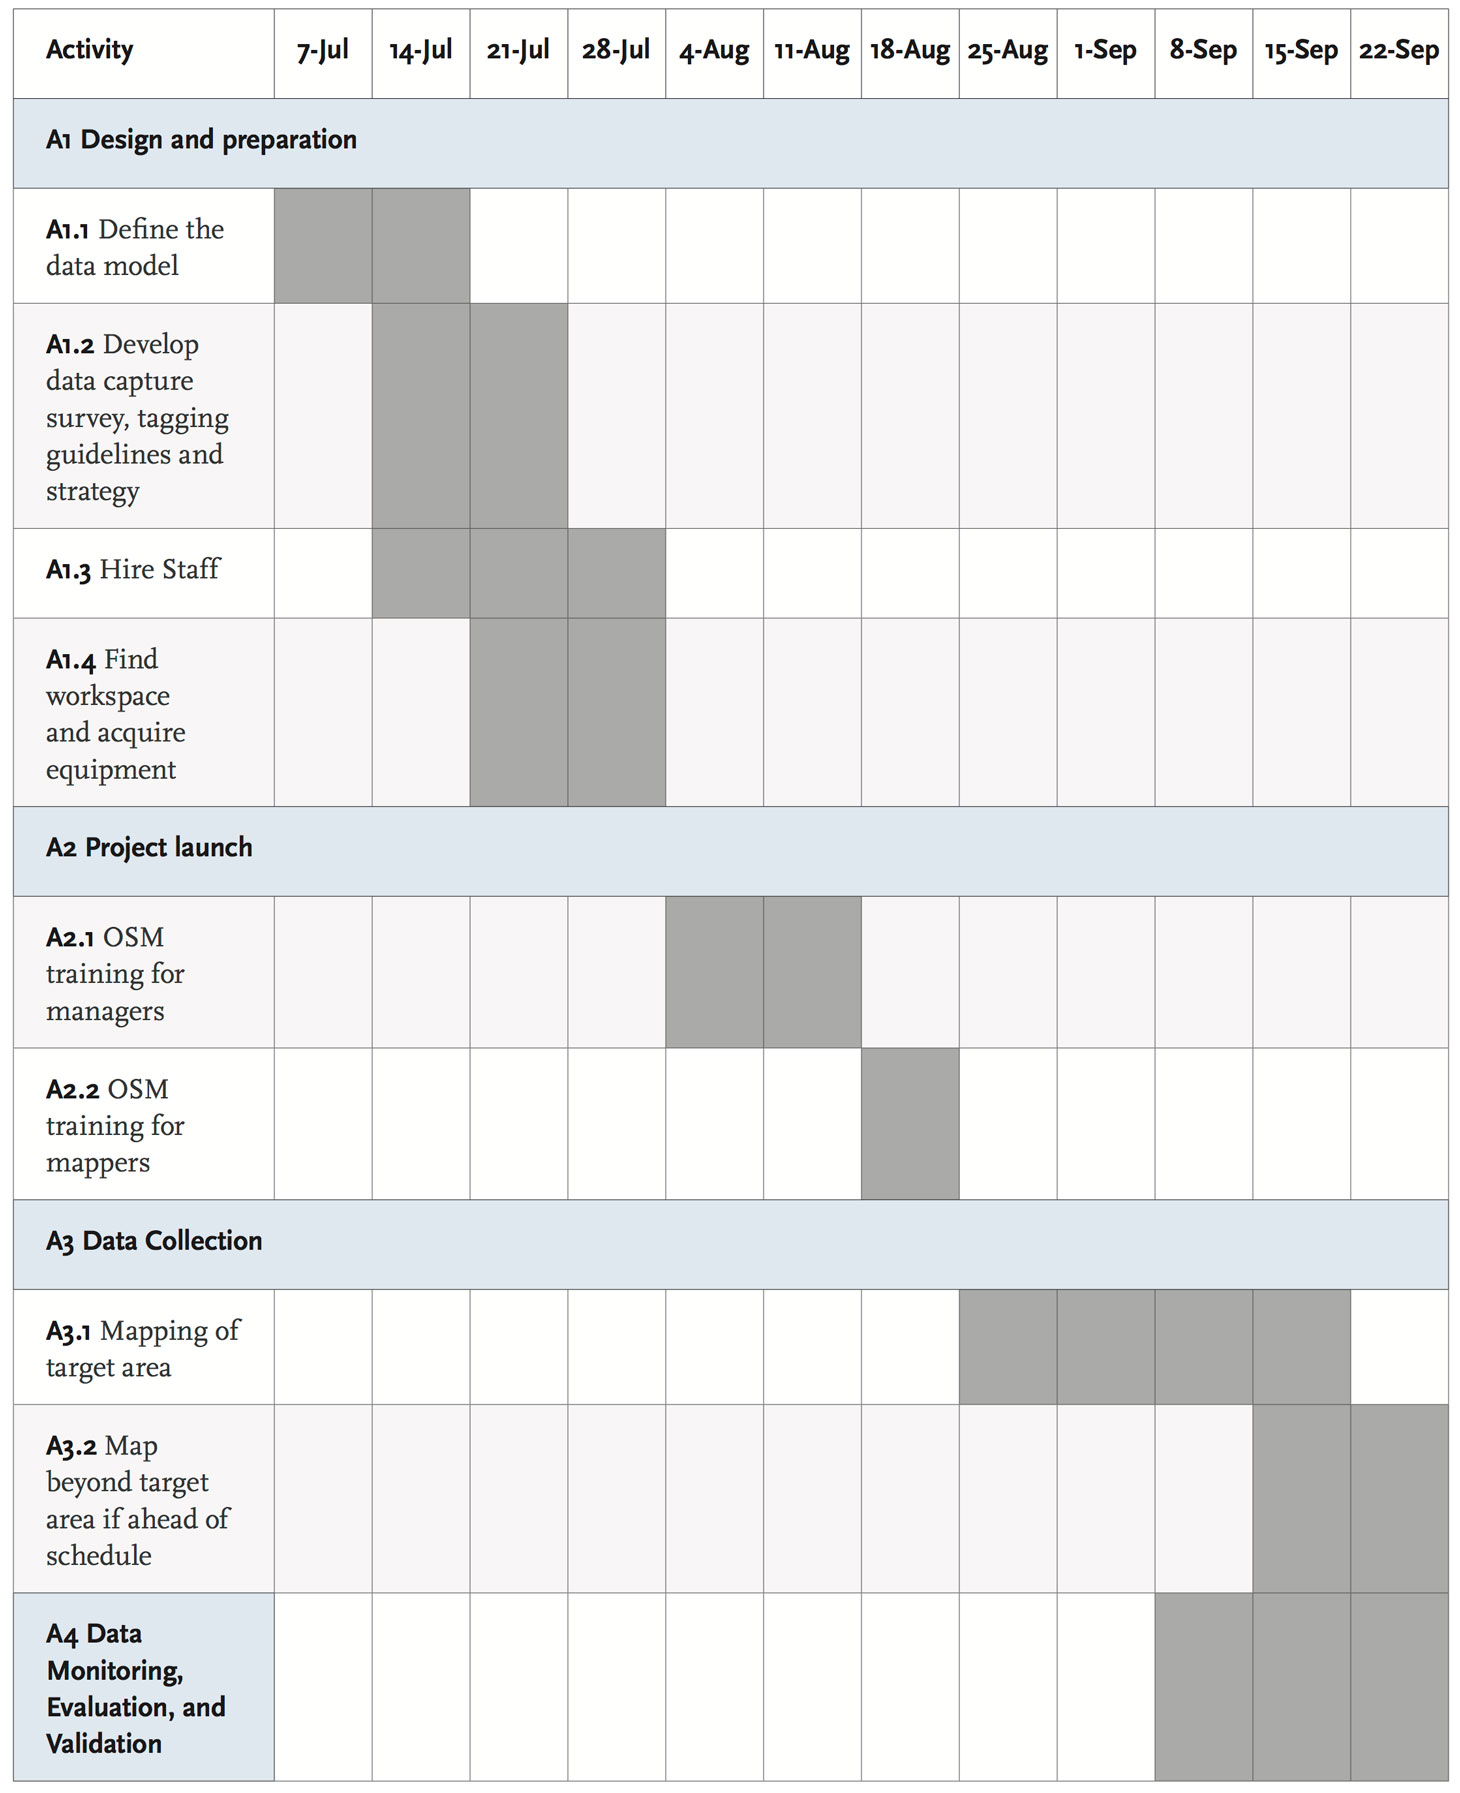
Figure 2.4 illustrates part of a sample project time frame.
During the Open Cities Dhaka pilot project, for example, a single survey team of two could collect field data for about 50 buildings per day by mapping for three or four hours. In some locations, it is common to cover 100 or more buildings per day. Use metrics like these to estimate how long it will take to map a certain region. If you can estimate the number of features in an area and the time it will take to map them, you can better understand the likely time frame of your project.
Figure 2.3: Sample Data Model of Features and Attributes
| Proposed Data Model | ||||||||||||||||
|---|---|---|---|---|---|---|---|---|---|---|---|---|---|---|---|---|
| Streets | Name & Address | Width | Surface Type (Bituminous, Pitch, Brick, etc.) | One way / Two way / not defined | ||||||||||||
| Buildings | Footprints | Usage | Number of Stories | Construction Type (categories consistent with CDMP 2007 survey) RCC/Brick/Block/ | ||||||||||||
Figure 2.4: Sample Project Time Frame
2.3 Assessing existing map resources
Once you have established the foundation of your project, you must assess the resources that are available for mapping. For example,
- Are there any preexisting data that will be useful and available? (Imagery, or GIS files of critical infrastructure, such as schools or hospitals, from a government partner, or agency working in the area)
- Is the target area covered by Bing or Mapbox, or Digital Globe imagery? Are other sources available? OpenAerialMap is an open service providing access to growing catalog of openly licensed imagery and map layer services.
- Is the resolution and timestamp of the freely available imagery suitable for mapping your study area?
- Will you need to fly a drone to acquire up-to-date imagery of sufficient quality? (If your project is in response to a recent event that had changed the landscape, including the destruction of property, then this may be the best option for you.)
- Do you have GPS units available? Mobile phones? Will you need them?
The purpose of such resources is twofold. First, it is always better to start with some objects already on the map, rather than with an empty canvas. If you already have two streets drawn on the map, you can easily add a school at their intersection. But if you don’t have those streets drawn on the map, you have no landmarks by which you can correctly locate the school, thus requiring much more work. Therefore, it is always best to have an existing base map before going into the field.
Second, these resources aid you while you are mapping. For example, if you are carrying a satellite picture with you while out surveying, you can usually identify objects by comparing what you see to what is shown on the image. This will also help you to understand the correct sizes and shapes of features. Later, the imagery can be used to accurately trace, or readjust polygonal features on OpenStreetMap.
2.3.1 Existing Digital and Paper Data
Because Open Cities uses the OSM platform, there will almost certainly be pre-existing data on the map. The OSM project has been around for nearly a decade, and there are few places in the world without at least a few roads already drawn. This is helpful because it means that Open Cities projects do not start from scratch. It is important to remember, however, that your project mappers should not delete features that others have created. The purpose here is to collaborate and work with other users as well. Once you have defined your project target area, it is a good idea to examine the existing OSM map and assess how detailed it already is. You should also contact any active OSM users in that area to let them know what the project is about and to see whether there are any opportunities for collaboration.
Often, other sources of data will also be available to you. Public government data might exist in either digital or paper format. In Open Cities Sri Lanka, regional paper maps already existed in each district. Surveyors used them as references to make improved, digital maps with OpenStreetMap.
Digital data often exist as well. In the Open Cities Dhaka pilot project, for example, the team received permission to use old government road and building data. They decided it would be easier to use these data as a base layer that could be updated rather than starting from a clean slate, and so the data were first imported into OpenStreetMap.
2.3.1.1 Data Imports
Importing data can save time and work if there are existing data that correspond to your data model and that you are free to use. For example, if you plan to map 5,000 buildings and the city government has footprints for all those buildings, you might consider importing the data into the OpenStreetMap database. Box 2.5 further discusses how to work successfully with the OSM community on data imports.
If it takes 30 seconds to draw the geometry of a building, then it would take approximately 40 hours to draw 5,000 buildings—a week of someone’s time.
Before you think about importing data, you must consider the following:
- Are the data of good quality? How and when were they created? Are they better than, as good as, or worse than data you would collect yourselves?
- Are the data in the public domain, or do you need explicit permission from the agency that created the data?
- Is the net benefit of importing the data greater than the cost of creating it new?
- Who will import the data?
Written permission is generally required from agencies that are willing to donate data to OpenStreetMap, and they must understand that once they offer the data, the data will go into an open-source database that anyone can use. Obtaining this permission can be easy in some cases, where opendata is becoming a more accepted concept, but many agencies are still rather protective of their data, and it remains a challenge to both acquire permission, and convey the meaning of an open license. For a sample permission letter, see Appendix 6.3.
Importing data is not difficult, but it requires an advanced understanding of OpenStreetMap and can take a significant amount of time, because imported data must be manually merged with existing OSM data. If you do decide that importing data is the right course to take, you must have a clear plan of how to import the data and discuss it beforehand with the OSM community.
A common question during any mapping project is, “Why can we use imagery from Bing, or Digital Globe but not from Google?” The short answer, and one not always easily understood, is licensing.
Any company or organization that sells or distributes imagery has a license describing what users are allowed to do with it. In most cases, people are forbidden from making derivative products. This means we are not allowed to use imagery to help make maps unless we receive specific permission to do so. Because Google has not given permission for the OSM community to use its imagery—or any other information from Google—as a resource, such use is not allowed, and edits derived from Google are illegal.
On the other hand, both Digital Globe and Microsoft have given explicit permission for OSM contributors to use their imagery, both of which have excellent quality imagery in many parts of the world. It is always best to check these resources first and to assess the quality of the images in your project’s target area. Available imagery sources can be viewed in the Java OpenStreetMap Editor (JOSM).
2.3.1.2 Other Local Data Sources
Consult the sources described below to find additional existing local data.
Mapping agencies. Most national governments have a department or agency that deals exclusively with mapping. Whether it is called the survey department or something else, it is responsible for managing a country’s geographic data. If the department or agency is willing to provide some of its data as public information, it can be a prime source for acquiring existing data.
National Statistical Offices. Most countries will have a dedicated department or agency that deals with the official counting and surveying of the population. Such agencies typically maintain the boundaries of enumeration units for the country - the administrative units to which census data is amalgamated. The statistical agency can be a key source of data for population estimates, and projections.
Urban development agencies. Some cities or countries have government departments specifically oriented toward urban development. Such agencies may possess a wealth of urban-oriented geodata.
OCHA. The UN’s Office for the Coordination of Humanitarian Affairs has had a local presence in many countries for many years. It typically has plenty of local knowledge and often is more willing than government agencies to make its data available.
NGOs. Typically hundreds if not thousands of NGOs exist in a given locale, and those working in certain fields may have collected data from previous projects. Organizations working in disaster relief, water and sanitation, or urban development are good places to begin asking around.
2.3.2 Availability of Imagery for Digitization
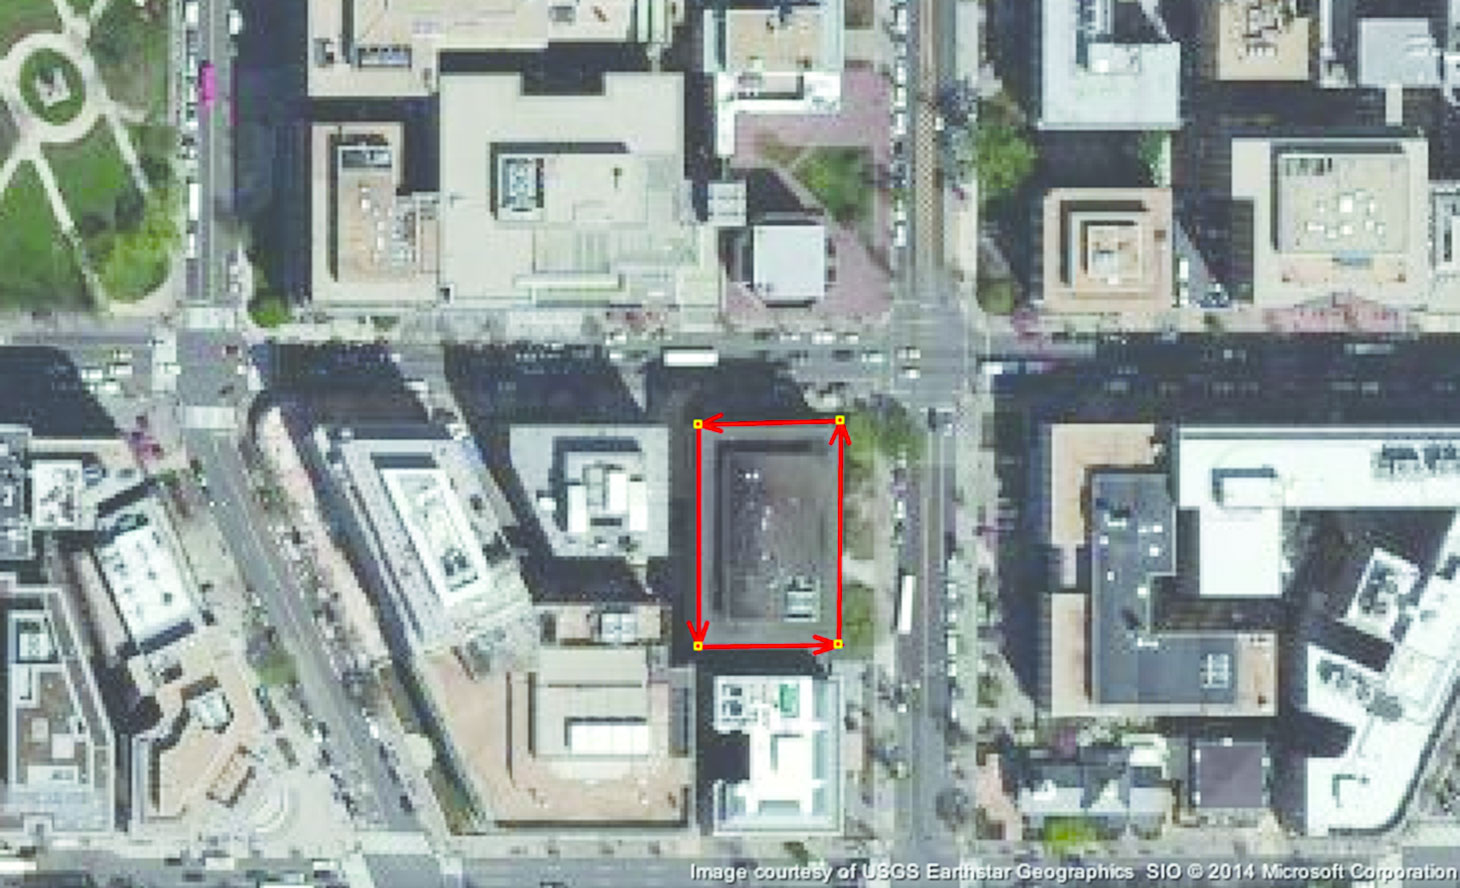
Perhaps the most effective aid in mapping is aerial imagery, as shown in figure 2.5. Aerial images are photographs taken from satellites or airplanes, which are then oriented accurately by their location on Earth.
Aerial images can be viewed as a background in the OpenStreetMap editing software. Mappers can use what they see to trace lines. This can be useful before field surveys, to create a skeleton base map that shows roads, buildings, and anything else that is identifiable solely from the imagery.
Aerial imagery can also be used during field surveys and editing. It can be printed out and carried in the field, helping mappers to orient themselves and identify features on the ground. Later, when they are editing, they can reference the sketches and notes they made in the field with the imagery in the editing software and accurately draw objects on the map.
While preparing for a project, the identification of suitable imagery should be undertaken early. If good quality, high-resolution imagery is available, this will benefit your project tremendously and mean less time and less work. If you cannot find good imagery, however, other methods will be required for digitizing objects on the ground.
Figure 2.5 Use of an Aerial Image to Trace Lines on a Map
2.3.2.1 Assessing Bing and Mapbox Imagery
Several imagery sources are available to OSM users, but those with the widest coverage and the highest-quality images are, DigitalGlobe, Microsoft’s Bing search engine (figure 2.6), ESRI and Mapbox, which provides open-source base maps, design tools, and OSM-powered street data. OpenAerialMap is also becoming an increasingly reliable imagery option. Box 2.2 discusses the importance of using only those sources that have given permission to use the imagery.
Figure 2.6: Example of a Good Aerial Imagery from Digital Globe Premium
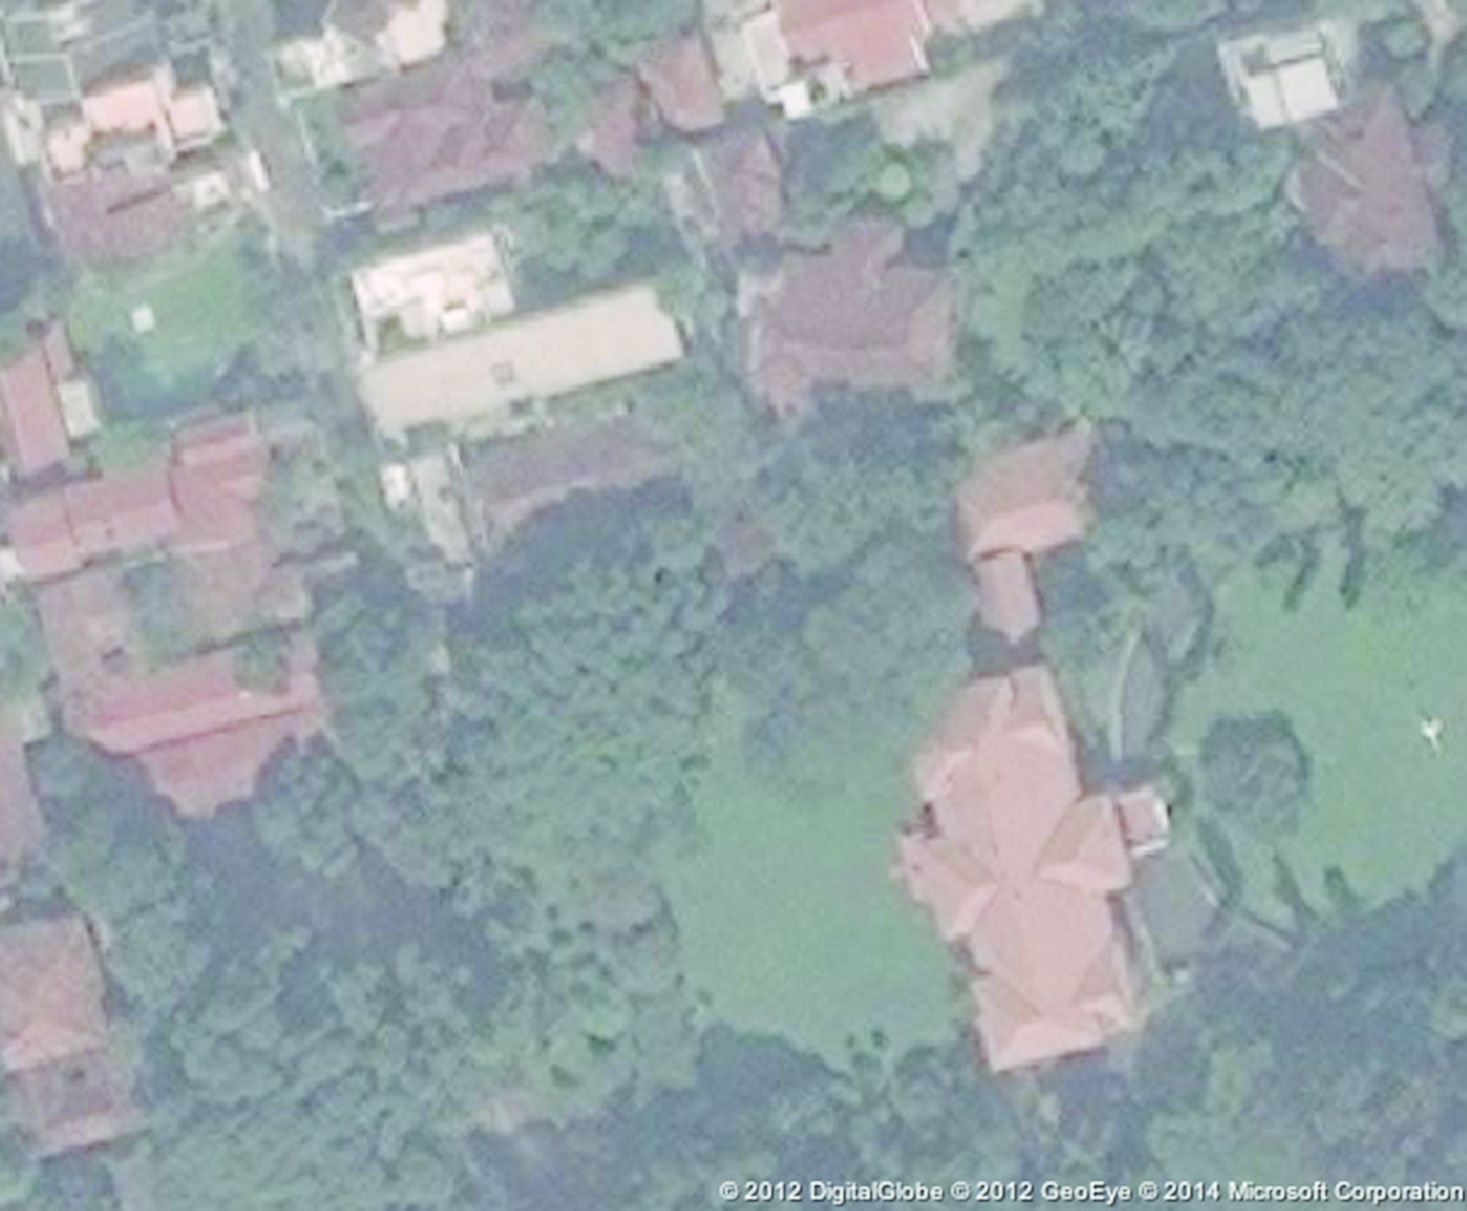
After defining your target area, you should assess to what extent you will be able to use this imagery, assuming that you plan to use it for your survey. If you are lucky, high-resolution imagery will cover your entire target area. Usually, however, parts of your target area will be obscured by clouds (figure 2.7) or not have high-resolution imagery at all.
Figure 2.7: Cloudy Aerial Imagery

During the planning stage, consider using GIS software to draw lines around the parts of your target area where Bing imagery will be suitable for mapping as well as those areas for which usable imagery is unavailable. This will help you understand what proportion of the target area will require another imagery source or a different methodology.
During the project’s design and preparation phase, the following tasks should be completed:
Partner Outreach
- Identify relevant partners in government, academia, and civil society
- Meet with potential partners, discussing support and areas of collaboration
- Communicate project goals with OpenStreetMap community and meet with local mappers
Defining the Scope of Work
- Obtain a map containing the boundary of the target area
- Estimate the number of features you will map in the area, such as roads, buildings, and so on
- Write out your data model
- Map the data model to OpenStreetMap tags
- Establish a rough time frame for survey completion, noting holiday periods that will halt the work
Building the Team
- Establish management structure
- Determine sources of your staff and how staff will be compensated
- Hire staff
Assessing Resources
- List the existing digital and paper data
- Determine whether you will import any data; if so, create an action plan and time frame
- Draw a map showing parts of your target area where no imagery is available
- Determine whether you will use GPS devices, smartphones, or both; if so, acquire
- Confirm that the necessary base-map data are available to use in Field Papers
2.3.2.2 DRONE IMAGERY
Another option for groups is to either commision or, to collect high resolution drone imagery for their study site. This is a high cost option, but, if the data collection project is in direct response to changes in the landscape, that have happened recently, then it may be the most reliable option.
Option 1: Hiring a drone operator
Considerations
- Cost (will this be a recurring cost that you are prepared for, if, you intend to increase the spatial scope of your project over time - perhaps ask about discounts for bulk work)
- Ownership rights (who owns the imagery, and what will the license for use contain)
- Post processing (does your provider georectify the imagery for you, so that it is ready to “plug and play” in OSM
- Permissions (make sure that any vendor you work with is appropriately licenses, and has permission to fly in the study area)
Option 2: Buying a drone
Considerations
- Cost (drones are relatively high cost, though there are some less expensive options. There is a trade off between ease of use, quality of the resulting imagery, and overall price. Does your group see a legitimate use for the equipment going forward. Do you have plans to map in other areas, or a business model to use the Drone for other ventures to offset the cost. Formal training is also quite costly)
- Training (team will need training on the use of the drone itself, and in the post processing of the imagery. Take into account, that formal training may be preferential, but can be expensive. Training, and testing will add considerable time to the work plan especially if licensing is required in the study country)
- Permissions (permission to fly, and licensing for the operator are all legitimate concerns, and can at cost, in both time and money to the project budget)
- Funding options (perhaps suggest application for grants, or, contacting the vendor directly to see if there are free/low cost programs for humanitarian/development efforts)
2.3.2.3 ALTERNATIVE IMAGERY SOURCES
Finding alternative imagery sources is a lot like finding possible data you can import. There is usually some imagery floating around, but it is often of questionable age and usefulness, and of even more questionable legal right to use.
Typically satellite images that have been purchased from a major provider like DigitalGlobe are not licensed for use in mapping in OpenStreetMap unless specifically designated as such, and any company or agency that has these data does not have the right to reuse the data for this purpose. However, imagery created directly by governments and companies may be usable. If someone is willing to donate imagery, the license should be investigated at the start.
Imagery can be purchased from companies such as DigitalGlobe, but this can quickly become expensive. It is usually best to find freely available sources of imagery, which are also more sustainable in the long run.
OpenAerialMap is an open service providing access to a growing catalog of openly licensed imagery, captured by unmanned aerial vehicles (UAV), or drones. As its catalog grows, OpenAerialMap is becoming an increasingly valuable imagery source for the OSM community.
In some cases, imagery is made available through the U.S. Department of State’s Imagery to the Crowd initiative. This is typically provided in the aftermath of disasters to aid remote mappers. Learn more about Imagery to the Crowd at mapgive.state.gov. Remember, too, that using aerial imagery as a background layer is generally considered to be the easiest way to map, particularly when many buildings need to be digitized.
Figure 2.8: A Field Papers Atlas Map, without Imagery, Used in Sumba Barat, Indonesia
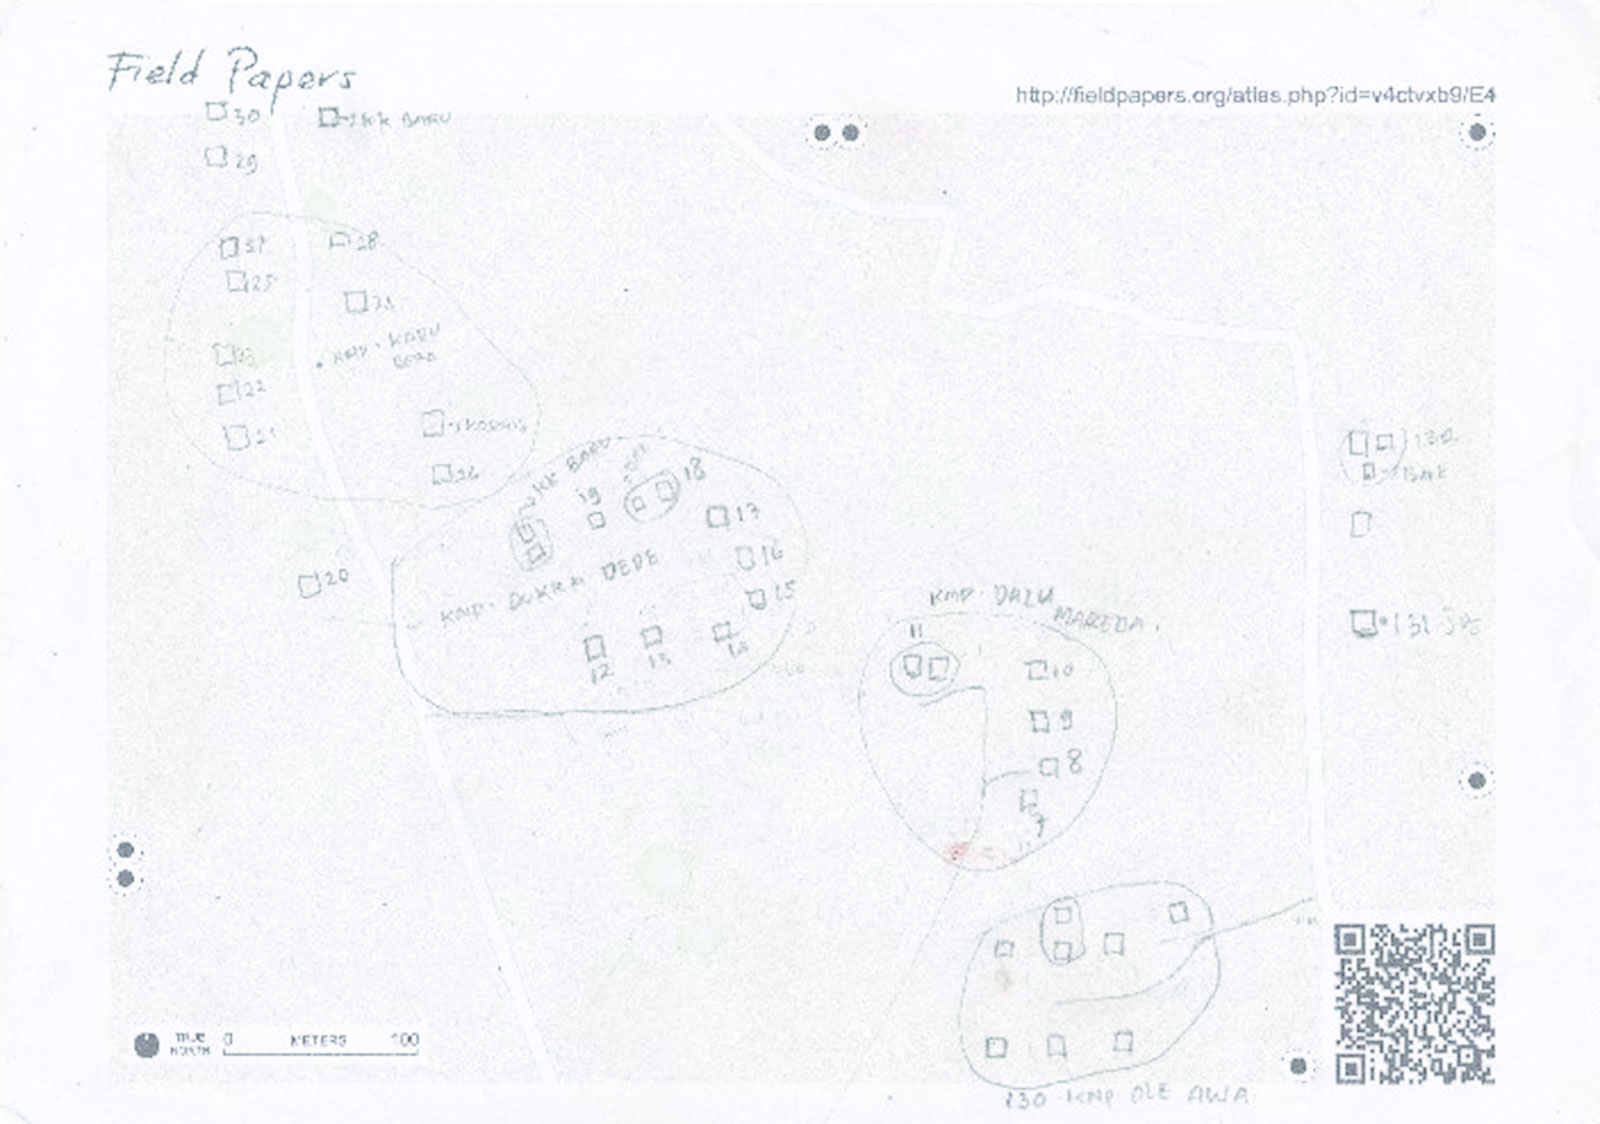
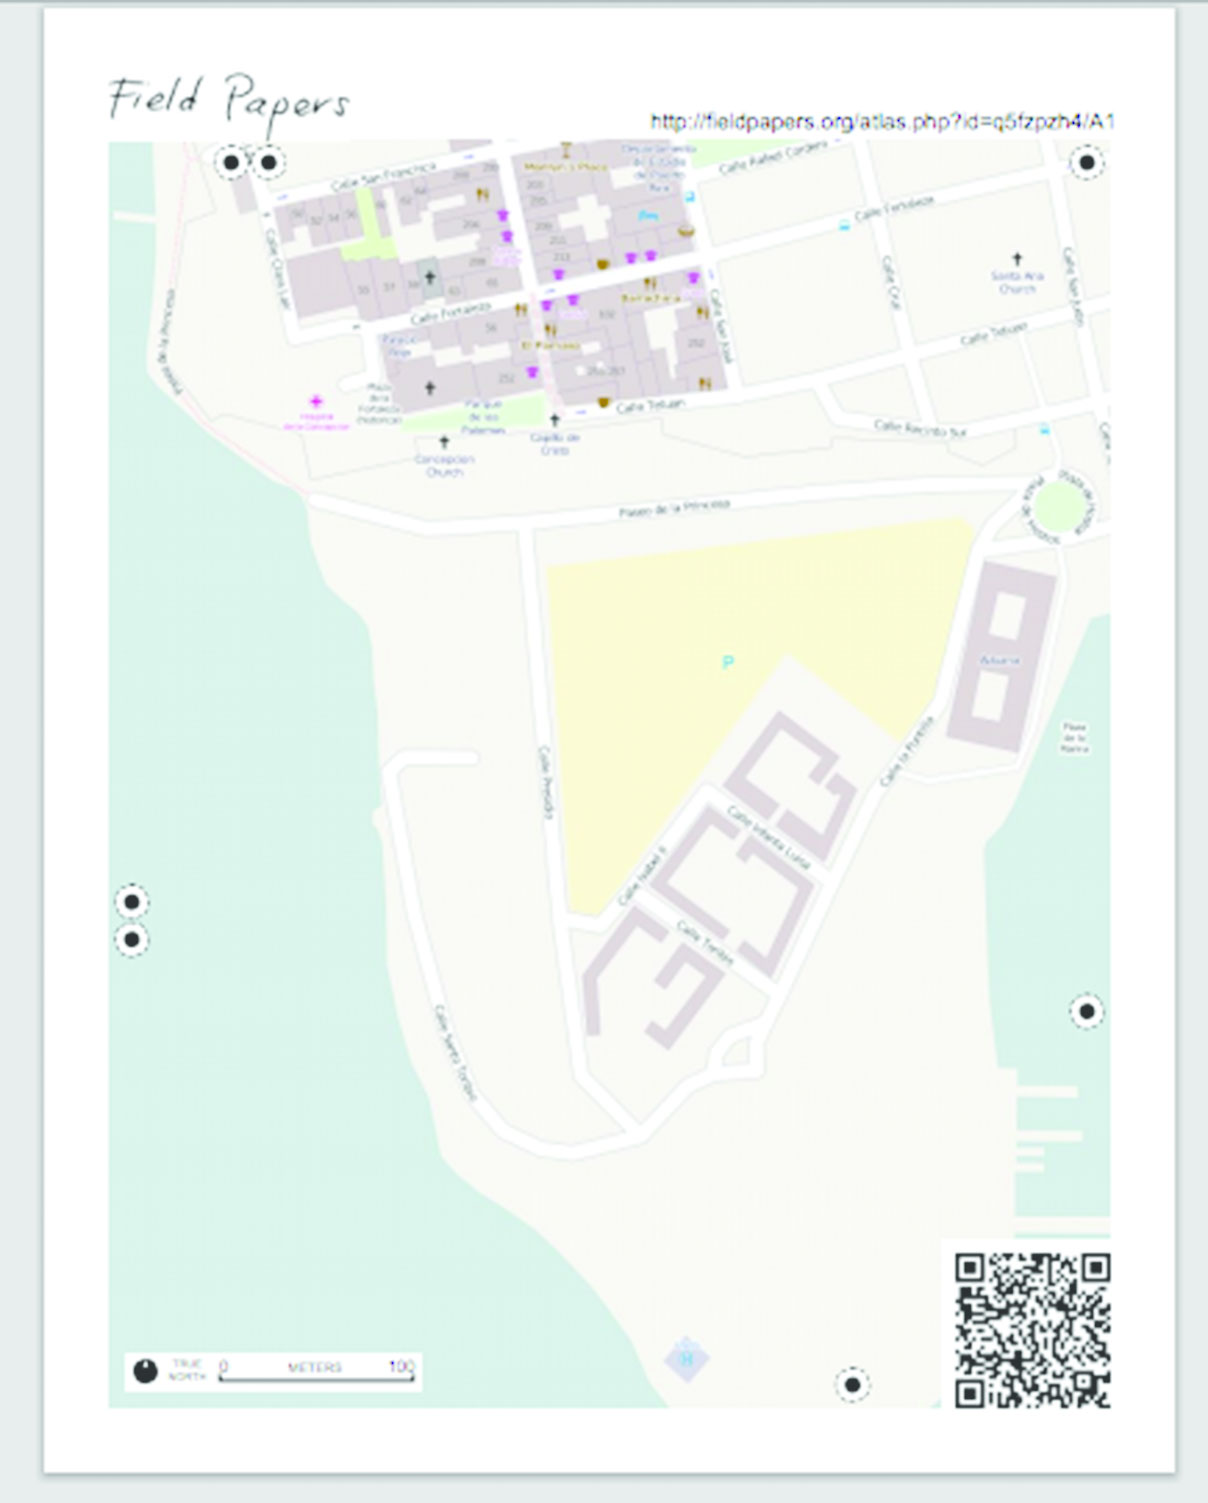
Figure 2.9: A Field Paper Atlas Map Example
2.3.3 GPS Devices, Field Papers, and Smartphones
If traceable imagery is unavailable for part or all of your target area, having a good base map becomes even more important. If detailed, existing data such as road networks and landmarks are already on the map, you should be able to use this as a reference to add new features in their correct locations. If a good base map is not already available, you will need to use GPS to build up a base map of your area.
GPS devices allow mappers to record paths along which they walk as well as individual locations, which are stored with accurate latitudes and longitudes. These data can be imported into JOSM and then traced to add features to the database. When no imagery is available, it is a good idea to use GPS to build up a base map first. Survey teams can first traverse an area with GPS devices, locating roads and major landmarks. In a second stage, they can use this base map as a reference to go out and collect more detailed data.
A service for OSM known as Field Papers enables mappers to print out a piece of paper that displays either an existing OSM map, satellite imagery, or a combination of both. The mappers take the Field Papers into the field, draw on them, write notes, and add features to the map—an example of which is shown in figure 2.8. Later, the papers can be scanned back into the computer and automatically geo-referenced to their correct locations on the globe. It is then a simple process of digitizing the hand-drawn notes.
This process can be used for building up the base map, as well as for the daily mapping activities of a project. Each day, mappers will print out Field Papers of small areas, which surveyors can use to sketch buildings and areas using the correctly located roads as a reference.
Figures 2.8 and 2.9 show examples using Field Papers “atlas maps.” Creating rough sketches of building shapes and their locations is not very precise, and often mappers wonder whether this is a problem. Ideally, building shapes will be more accurate, but such accuracy is difficult without high resolution imagery to use as a reference. If this mapping methodology is used, it is not a major problem. More important than precise building size and location is the topology—which helps to ensure that the buildings are placed correctly in relation to each other and in relation to the (accurately positioned) roads.
Field papers are not just a paper reference of what you encounter in the field. Each map sheet has a unique QR code that allows the team member to photograph, or scan the map and georeference it, so that it can be displayed in an OSM editor. Using the field paper as “Wallpaper”, desktop mappers can digitally trace the work of the field mapper, and transfer/transcribe any attribute that the field mapper has documented on the map sheet.
Even if a mapping project intends to rely on mobile technology for field data collection; it is always a good idea to take field papers into the field, as unanticipated tech issues, or, infrastructure inconsistent with the imagery displayed on screen, is much easier to edit, or document directly onto the field papers.
2.3.3.1 MOBILE APPLICATIONS
You can use various different mobile applications to collect OpenStreetMap data, and the list continues to grow rapidly. Although mobile mapping applications are useful, none of them provides the range of editing features found on the desktop software. Mobile applications are best at mapping points of interest. For a list of Android editing applications, see: http://wiki.openstreetmap.org/wiki/Android#OpenStreetMap_editing_features.
Some of the more popular applications are listed below:
- Mapillary: Mapillary is a crowd-sourced service for sharing geotagged photos. Users can upload and share street-level images of places around the world, similar to Google's proprietary StreetView. Uploaded photos become immediately available for all editors and anyone with a smartphone or computer is able to contribute.
- Maps.me: This mobile application allows users to add tags in OSM and download offline maps. Data uploaded is immediately live in the OSM database. The app is available for iOS, Android, and Blackberry.
- OSM Contributor: Useful for mapping parties, this mobile application is used to map and to manage group mapping. Mappers can add, edit, and remove nodes, ways, and comments. Mapping managers can limit contributions by data type and region.
- OsmAnd: This mobile application offers offline OpenStreetMap viewing on smartphones and navigation capabilities for Android. OsmAnd’s Editing plugin allows users to create points and edit tags directly on OSM. Users can also turn on the trip recording plugin to automatically trace the path of their journey as a track on https://www.openstreetmap.org/traces.
- OSMTracker: An offline GPS tracker for collecting points of interest and recording GPX tracks. OSMTracker creates a gpx trace of a user's journey with waypoints along the route. Voice recording, photographs, and notes can also be geolocated along the route. Data exported is compatible with the offline JOSM map editor.
- OpenDataKit and OpenMapKit: Open Data Kit (ODK) is a free and open-source toolset which allows the user to build a mobile data collection form or survey, and aggregate the collected data on a server. OpenDataKit is integrated with the OpenMapKit (OMK) extension, an Android app allowing ODK users to georeference survey data directly to unique OSM features. OMK also supports OSM feature selection and tagging.
- KoBoCollect: KoBoCollect is based on the open source application OpenDataKit. KoBo allows you to build surveys and collect data on a range of subjects from household assessments to building materials. KoBo does not tie directly to OSM in the way that the previous applications do, so requires a process for the reconciliation of collected on KoBo, with OSM itself.
- Vespucci: The Vespucci Android application allows online and offline OSM editing. Editing is supported by rich, extensible and searchable presets based on the JOSM system and compatible 3rd party presets can be downloaded directly to your device.
2.4 Building the Team (staffing)
While preparing for your project, consider the logistics that will be involved in terms of staff and office work. Remember that half of the job involves surveying the target area, and the other half is editing work on computers, some of which may need to happen before any field mapping takes place. You may have a small project team, or you may have dozens of people or more. Box 2.4 discusses some of these considerations.
Consider whether all of your staff will perform some desktop editing, or whether you will divide the tasks of surveyor and editor. It is generally beneficial for mappers to do both surveying and editing, rather than splitting the work, because mappers remember what they have surveyed; even with detailed notes, nobody will be able to edit the map as well as the person who surveyed the features being mapped. Editing tasks also help to overcome “survey fatigue”—when surveyors tire from spending most of their days walking around to perform a single task (and vice versa for editors staying at the computer all day). That said, logistical considerations may require that these two tasks be split, or that different people are editing in the office at different times.
Open Cities mapping project teams generally include people in the several roles described below.
DATA COLLECTION
Surveyor and Editor (Mapper)
Surveyors typically work in pairs. Each pair is responsible for field surveying—usually during half of the day, as it can be quite physically tiring. They may also engage in small tasks such as printing field papers. In most projects, each survey team also edits its own work, but these roles can be split. Each day, the pairs will be tasked with part of the target area to map, and they will spend three to five hours surveying, with the remainder of their time spent editing the data.
Validator
Experienced editors may dedicate some or all of their time to the quality assurance process as data validators. Validators review collected data for errors and inconsistencies. Validators are assigned areas they have not personally surveyed in order to spot and correct inconsistent practices between survey teams.
MANAGEMENT
Project Lead/Manager
At the top of the management structure is typically a project lead (PL). The PL may be the same person as the project manager, or the two roles may be separated. Ideally, the PL will have in-depth local knowledge and relationships with government and academia. The PL, aside from supervising the mapping project, is usually responsible for high-level discussions with partners and community outreach. The PL should be well versed in field data collection and skilled in project management, mapping and GIS, communication skills, and community building.
Mapping Supervisor
A small pilot project may have only a single supervisor, or there may be multiple team supervisors, each of whom manages a subset of mappers, and who report to a top-level project manager. Supervisors are responsible for organizing the project workflow, supervising and aiding mappers, and managing equipment and logistics.
DEVELOPMENT & SUPPORT
Communications Officer
Depending on the project size and length, a devoted communications officer may be necessary to focus on external communications, social networking, community building and integration. The participatory aspect of Open Cities is built around solid and regular communication.
Technical Support
A devoted technician may be required for setting up and managing software and hardware for the survey efforts, especially if the mapping team is large.
GIS or Information Officer
The project may require specific analytical tools, products, or other outputs. Therefore it is important to have someone on the team who can produce high quality maps and information products based on the data collected.
2.4.1 Management Structure, Roles, and Responsibilities
You can organize your staff in various ways. A single manager can supervise a large group of mappers, or you may choose to divide the team into a number of smaller teams that can operate somewhat independently. (Box 2.4 describes some of these roles.) Either way, you will need people to perform the following tasks:
- Field surveying
- Editing
- Printing Field Papers (see 2.4.3)
- Managing equipment
- Organizing workflow
- Procuring office supplies
- Quality assurance
- Technical support
- Training, and volunteer mobilization
- Communication and outreach (both to the community, and to partner organizations)
- Data Analytics and map production
Mappers are responsible for the day-to-day activities of a project. They are the ones going out to different locations each day within the target area, identifying features, and writing down attributes. They also spend time in the project office, editing the data they collect each day and adding those data to OpenStreetMap. Because their skills will grow, the quality and pace of their work will improve over time. Mappers may also perform office tasks, procure supplies, work with volunteers, or train partner organizations.
A good manager should keep the mappers on schedule and help them as needed. Managers will be more experienced in GIS and OpenStreetMap, so that they can effectively advise mappers during the editing process. It is important that managers check for mistakes and errors in the data, especially early in a project, so that they can inform mappers of their mistakes before they are repeated hundreds of times.
Good managers also maintain strong communication with their mappers and should occasionally accompany them during surveys to observe their work and offer advice. Managers are responsible for performing quality assurance surveys, which will be discussed in section 4.3, “Quality Control.”
What is the OSM Community? OpenStreetMap is a collaborative project involving hundreds of thousands of users and contributors, and the “OSM community” comprises those active members who continually participate by adding to or updating the map.
Each country has what might be called its own community (or in some cases multiple groups), who communicate, plan activities, and work together to improve the map. And each country’s community is also connected to the larger global OSM user base. Because an Open Cities project uses the OSM platform, it is automatically engaged in this community. Section 2.2.2.2 earlier provided more information about engaging the local OSM community.
Most OpenStreetMap users go out and contribute to the map bit by bit, so they should be consulted before importing their data. The import might overwrite the work of other mappers who have actually conducted field surveys. You must also send an e-mail to imports@openstreetmap.org and let them know what you are planning. Ensuring that they are aware and supportive of the process before any importing takes place can save a lot of time explaining or reverting the changes after the fact.
For a complete description of the steps to be taken for an OSM import, view this OSM Wiki page: http://wiki.openstreetmap.org/wiki/Import/Guidelines
.2.4.2 Finding Mappers and Surveyors
Survey staff are often sourced from universities and from recent university graduates. Prolonged field activity can be demanding and is suitable for young people who have an interest in fields related to GIS, geography, urban planning, and engineering. However, the surveying and editing process is not difficult; with the right training, anyone can fill the role, even those with limited computer experience. Those with less computer and geography experience may take longer to train but can still fulfill the job requirements, and direct knowledge of the study area being mapped can be a distinct advantage. Mappers are also often found through other partners, such as government agencies, youth groups, and high schools.
As you reach out to potential partners, key influencers and casual mappers will be identified who are interested in the project focus and can be added to the team as the project expands. A unique aspect of the Open Cities data collection methodology is the use of crowdsourcing from both the international and local OSM mapping communities. When engaging the local community, it is often students who have the time and interest to contribute to the project. An Open Cities project provides the opportunity for knowledge exchange between academia and the implementing organization. As a result, the surveyors can be sourced from local university students and recent graduates in geography, computer science, or other project-related technical disciplines. Check for a Youthmappers chapter in your area to engage (http://www.youthmappers.org/chapter-listing).
2.4.3 Compensation and Incentives
There are various methods for compensating project members depending on their background and interests. If you assemble a management structure with a team of managers (known as a core project team), they will most likely be paid as full-time staff. Others, such as volunteer students or young professionals, may either be strictly volunteers, incentivized through an internship or academic credit, or offered per diem or even full-time payment.
Because OpenStreetMap is an open data project built around a community of volunteers, a frequent debate concerns whether mappers should be paid during a targeted mapping project. On the one hand, it is preferable to find ways to encourage mapping other than payment in order to foster a sustainable initiative and mapping community. On the other hand, a targeted mapping project may require mappers to dedicate a great deal of their time to complete the work within a given time frame. In the end, the choices about how to compensate or incentivize mappers will depend on the particular demands of the project.
Volunteer mappers can be incentivized by designing the position as an internship opportunity, by working with universities so that they receive academic credit, or by simply offering the reward of community service and skills development. The broader benefits of participation were discussed earlier, in section 2.1.1.
Another approach toward providing incentives is to develop competitions between universities, departments, or parts of the mapping community. Although monetary rewards have been found to lead to a spike in data collection, collection may also dramatically decrease after a competition is over. Therefore, although competitions provide a potentially useful way to gather a lot of data, they are not necessarily a good way to support community growth in the project focus area. In the case of a mapping competition, creative prizes or rewards (such as mapping hardware) can be used as incentives that may not result in temporary, opportunistic mapping.
LOGISTICS & TRAINING
3.1 Finding a workspace
A major consideration is the location of the project office. If you already have an office, you should consider whether it is in, or close to, the target area. Remember that travel between the editing location and the area being mapped is time-consuming; hence, planning transportation logistics is important. If you can save your mappers some time, the project should take less time and cost less money. It may be worthwhile to organize an office space close to the target area so that the mapping process runs more smoothly.
In any case, care should be taken so that the office used for editing has a minimum of electrical, computer, and Internet problems. Because OpenStreetMap editing works best with a good Internet connection, frequent disconnection is enough to effectively halt the process, wasting valuable time and slowing progress. If your staff comes in for editing and has no Internet access, they have nothing to do and you lose half a day of time. A prolonged outage can be even more costly.
If Internet access is often lost, consider purchasing backup connections such as 3G modems. The additional cost often will outweigh the cost of lost time while waiting for service to return.
Other considerations for your workspace include opportunities for community engagement and collaborative work. While not strictly necessary, it may be beneficial to have a meeting room that can accommodate a dozen people—ideally one that is easily reconfigurable to serve a wide variety of functions. Training could also be conducted here, although if you have many mappers to train, you may need to identify a larger facility for the initial training.
When possible, the office should provide a creative communal space furnished with items such as whiteboards and couches. This will encourage open discussion and facilitate brainstorming to identify current and future challenges, examine alternatives, and develop solutions or alternative actions.
The initial project phases involve engaging the local OSM community and hosting mapping workshops (or mapping parties) to raise awareness of the Open Cities project and identify interested individuals, communities, schools, government departments, and private organizations. Mapping parties can be organized either at the project office or at other venues in the focus area such as university labs, private or public offices, community centers, and libraries. Of course, the budget should take into consideration the potential costs of renting these temporary venues.
3.2 Equipment and other costs
When you are preparing a mapping project budget, be sure to consider a number of other potential costs, including the equipment, supply, and service expenses described below. See box 3.1 for an estimate of the hardware needed to serve a 10-person project team.
The following hardware will serve a project team of at least 10 people, depending on mapping methodology:
- 5 laptops (assumes one mapping team per laptop)
- 5 android phones (if you plan on a mobile survey, maps.me, or mapillary)
- 2 GPS devices (assumes you will use GPS, but not all the time)
- 1 printer (for printing Field Papers and survey forms) along with necessary ink and paper
- 1 projector (for presenting the project to partners and for trainings)
3.2.1 Hardware Needs
Computers: Data entry and analysis for OSM generally requires desktop or laptop computers. Laptops, being portable, can also be used to facilitate training sessions or mapping parties at venues away from the team’s office. Typically, one computer for every two members of your mapping team will suffice, unless the project requires an aggressive desktop mapping component before fieldwork takes place. Then access to additional machines, at least for the first desktop mapping phase would be important.
Projector: A projector is required for sensitization and awareness-raising presentations and in mapping workshops where the venue does not provide a projector. It will also be used when these presentations are offered at the office.
Handheld GPS devices: GPS units will record the “track” of the mappers (where they went while collecting data) and can record points of interest (POIs). With the improved quality of GPS technology on mobile devices, many teams opt to use their phones exclusively to gather GPS data, especially as tracking and recording features are built in to many of the apps dedicated to OSM data collection.
Mobile Android mapping devices: Instead of GPS units, you may opt to use Mobile Android devices. A variety of smartphone applications provide specific OSM mapping functionality, as well as the added benefit of mobile survey deployment (tools like OpenDataKit, or Kobo Collect), should your project incorporate this activity. Currently, Android applications such as Maps.me, OSMAnd, Mapillary and OSMTracker are popular. Mobile devices such as these usually have GPS chips inside them, allowing them to behave like a GPS device, but with additional functionality.
Drones:Drones are becoming an increasingly popular addition to the OSM workflow for community mapping projects. They allow immediate access to high resolution imagery, which can be captured on demand for a particular study area. This is extremely useful in areas where the the resolution of standard Bing or Digital Globe imagery is not sufficient to support quality desktop mapping. This is often the case in densely populated areas, where identification of individual rooftops is difficult when capturing buildings. They are also important in study areas where ground conditions are apt to change (such as communities that suffer from regular flooding, or progressive erosion). Regularly captured imagery allows us to map change over time, and to provide time stamped situational awareness for both response and planning purposes. Despite the attractiveness of “Imagery on demand” - drones come with many financial and logistical considerations. Teams must consider the initial cost of the equipment, and any training that will be required. This applies to both the manual operation of the equipment, but also the post processing of the imagery for use in open source applications. There may also be legal restrictions on drone operation in one’s country, or a licensing process for new drone operators. These factors need to be considered in both the budget and timeline aspect of any projects, as the cost, and time investment may outweigh the benefits.
3.2.2 Printing Needs
Printer: A printer will be needed to print the Field Papers. If you are using paper survey forms to collect attributes for many features, such as buildings, you may require thousands of photocopies. This process takes time and money, and it should be considered while planning logistics. Mapping teams are increasingly turning to mobile device for survey collection, and though the initial cost may be higher, they can prove to be more cost effective, and time efficient in the long run.
Business cards and brochures: These materials are useful when establishing credibility in the field. Community members can be suspicious of mappers collecting data, and it is necessary to ease their concerns. A printed brochure will outline the project methodology and goals. Cards and brochures can easily be distributed while collecting data in the field—raising awareness of the project in the community and boosting credibility when fielding questions. Business cards and brochures should be distributed at all presentations and meetings. Mappers can also display their credentials using lanyards with clear display pockets.
Letters of Support: If preparing a brochure package for field mappers to use for community informational purposes, it would be a good idea to print and include any letters of support from the local government.
Event signage and promotional materials: Other printed materials include banners and posters for larger events such as mapping workshops.
3.2.3 Mapping Workshop Expenses
Rent: Community mapping workshops should be held in a variety of locations, in order to expose a wide range of actors to the process. Where possible, a host should be identified to provide the venue. This could be a community center, a local government office, or, a university building. If this is not feasible, a venue should be rented.
Food: Although workshops will vary in length, they should typically be half- or full-day events (Three hours minimum for adequate training, and some mapping). Providing a meal, such as lunch for the mappers, or even coffee and snacks can go a long way toward increasing productivity and general well-being. Identifying potential sponsors for these activities, can help to offset the cost of training events (sponsorship can include space donation, help with rental fees, WIFI costs, or food costs). In many cases sponsor employees may like to be involved in the training and mapping activities.
Internet connectivity and electricity: Internet connectivity is a critical consideration for all stages of a community mapping effort and, where possible, groups should establish redundant systems in case connectivity fails. Mobile hotspots can be sufficient for small groups of mappers, or for loading field papers, but typically insufficient for a Mapathon. Rechargeable batteries or power banks should be available for the projector and any GPS devices or smartphones
3.2.4 Surveying Expenses
Surveying and office supplies: The mappers will need clipboards, pens, and pencils to complete surveying tasks.
Transportation expenses: When specific sites have been identified to map, transportation may be required to take mappers into the field and return them to the venue, where data can be entered to OSM.
Mobile Android mapping devices: As mentioned in the previous section, mobile android devices are an efficient, and in many ways more cost effective approach to survey data collection.
3.3 Training
Once you have established your management structure and hired staff, you will need to train them. On a practical level, they will need to know how to map with OpenStreetMap, how to use the JOSM or iD editing software, and how to create and use Field Papers as well as any specialized information about the data they will be collecting. For example, if they are collecting data on buildings’ structural attributes, they will need to learn some engineering basics. We can separate the training components into two broad areas: those concerning OpenStreetMap tools and software and those concerning surveying techniques and understanding the data model.
Take the time and care to train the staff thoroughly. Remember that you are essentially training your future trainers, because good managers and mappers will be able to teach others about mapping and offer trainings with partner organizations and with volunteers. If it fits within your management structure, it is a good idea to a have a core team of managers who are more extensively trained than the mappers whom they oversee. The core team should become experts in OpenStreetMap and surveying techniques, so they will be equipped to manage and provide answers to other mappers. In Open Cities Dhaka, for example, a core team was trained over the course of a week and went to the field each day to practice surveying and then editing in the office. Although they were not experts after a week, they were able to lead a two-day training for a larger group of mappers and answer most of their questions.
3.3.1 Training on Mapping Tools
Basic OpenStreetMap training can take as few as two days. This is a typical amount of time to work through the beginner training material available on learnosm.org. However, learning OSM in depth requires time and plenty of practice. Training should include both classroom time to work through the software step by step and multiple field excursions.
While training core staff, it is a good idea to dedicate at least one week and sometimes two simply to mapping and training. That way, the staff will have plenty of supervised practice before they supervise others. This training period can also overlap with project preparation. Even after training is complete and mappers are doing their job, take care to watch for mistakes and help the mappers continue to learn.
A typical OSM training outline includes the following:
-
Desktop Mapping
- Introduction to OpenStreetMap and signing up for an account
- Using OSM’s online editor, iD
- Understanding OSM concepts such as nodes, ways, and tags
- Using aerial imagery to edit
- Using the OSM Tasking Manager for Project management
- Using the offline editing software, JOSM
- Creating and using Field Papers to map (this also requires training on the full workflow, on how to take the data from Field Papers, and re-enter it in OSM)
- Using a GPS device to map
- Using Mobile applications to map in OSM
- Using Mobile devices to collect and/or upplement map data
Mapping in the field
These are the main areas to cover when training beginners for active participation in a mapping project, but the list can be expanded or shortened, depending on the training needs.
There are several wonderful resources for online training materials, please visit the following pages for an introduction to these tools, and training materials to get you started:
- LearnOSM (learnosm.org)
The OpenStreetMap and HOT community created LearnOSM as a resource for mappers and trainers. LearnOSM materials include step-by-step guides for new OSM contributors and data users and tips for running your own OSM workshop. - MapGive (mapgive.state.gov)
MapGive is a United States Department of State public diplomacy program designed to engage volunteers to map in OSM for humanitarian and development missions. The MapGive training materials include guidelines and resources for those seeking to organize a small- or large-scale mapping project, such as an event logistics guide, checklists, case studies, and printed materials. - Humanitarian OpenStreetMap
HOT provides training workshops in open data and open mapping tools and supports community mapping projects around the world. In addition to the guides and materials maintained on LearnOSM, HOT has uploaded a variety of training videos for beginning mappers and trainers on YouTube (https://www.youtube.com/user/hotosm). - Missing Maps
The Missing Maps website is host to beginner tutorials for online mapping and validation as a resource for remote mapping volunteers (http://www.missingmaps.org/learn/). - Mapillary
Mapillary provides instructional videos for integrating photo mapping with OSM tools like JOSM and iD editor (https://goo.gl/jNc27Y).
3.3.2 Training on Surveying
The second training component concerns your project’s specific data model and how to collect accurate attributes in the field.
Simply, a data model refers to a schema or list of all the mappable objects that you wish to collect information about, and the specific pieces of information (variables/labels or tags) you wish to record about those objects. A well designed data model should have a very specific list of predefined variables/labels or tags for each type of object. This allows us to classify and quantify the data that we collect, as well as symbolize it in a consistent way.
Once a data model has been designed for a project, a survey can be created around it to capture the data in the field. For example, in the pilot project in Dhaka, structural attributes about individual buildings were collected, such as the type of structure and whether the buildings had vertical irregularity. As most surveyors were not engineers, this training required several days, which included practice identifying buildings in the field.
The amount of training time that should be dedicated to this component depends on the complexity of your data model and the background of the mappers. For example, not much instruction is required to collect only street names and surface types. But if you are collecting detailed structural attributes of buildings, mappers will likely need to learn some engineering basics in order to identify various attributes. They will also need precise definitions of those attributes. For example, if one of the attributes you are collecting is the building’s condition, and the possible values are “poor,” “average,” and “fair,” you will need a precise description of each of these subjective terms.
It is a good idea to develop a survey training manual for mappers that includes clear descriptions of the various attributes you are collecting along with photographs, they they can take to the field for reference purposes. In the Open Cities Dhaka project, for example, the survey required detailed engineering knowledge. The team’s training manual clearly showed the differences between types of masonry, for example. It was also particularly valuable to differentiate subjective attributes, such whether a building’s physical condition was “poor,” “average,” or “good.” Mappers had clear definitions for each so they could accurately and uniformly identify those values in the field.
All said, a week of training is probably more than adequate for most projects, and this can be combined with actual mapping activities that managers lead or supervise. The more experience mappers have, the better they will do, but they will need ongoing guidance as they learn how to map properly.
Logistic
- Identify where your staff will work
- Ensure reliable Internet connectivity
- List the equipment you need and acquire it
Training
- Identify who will conduct the training and what material will be covered
- Collect necessary training materials, develop training manual
- Identify a location to host the training (maybe the same as the project office)
- Create a training schedule
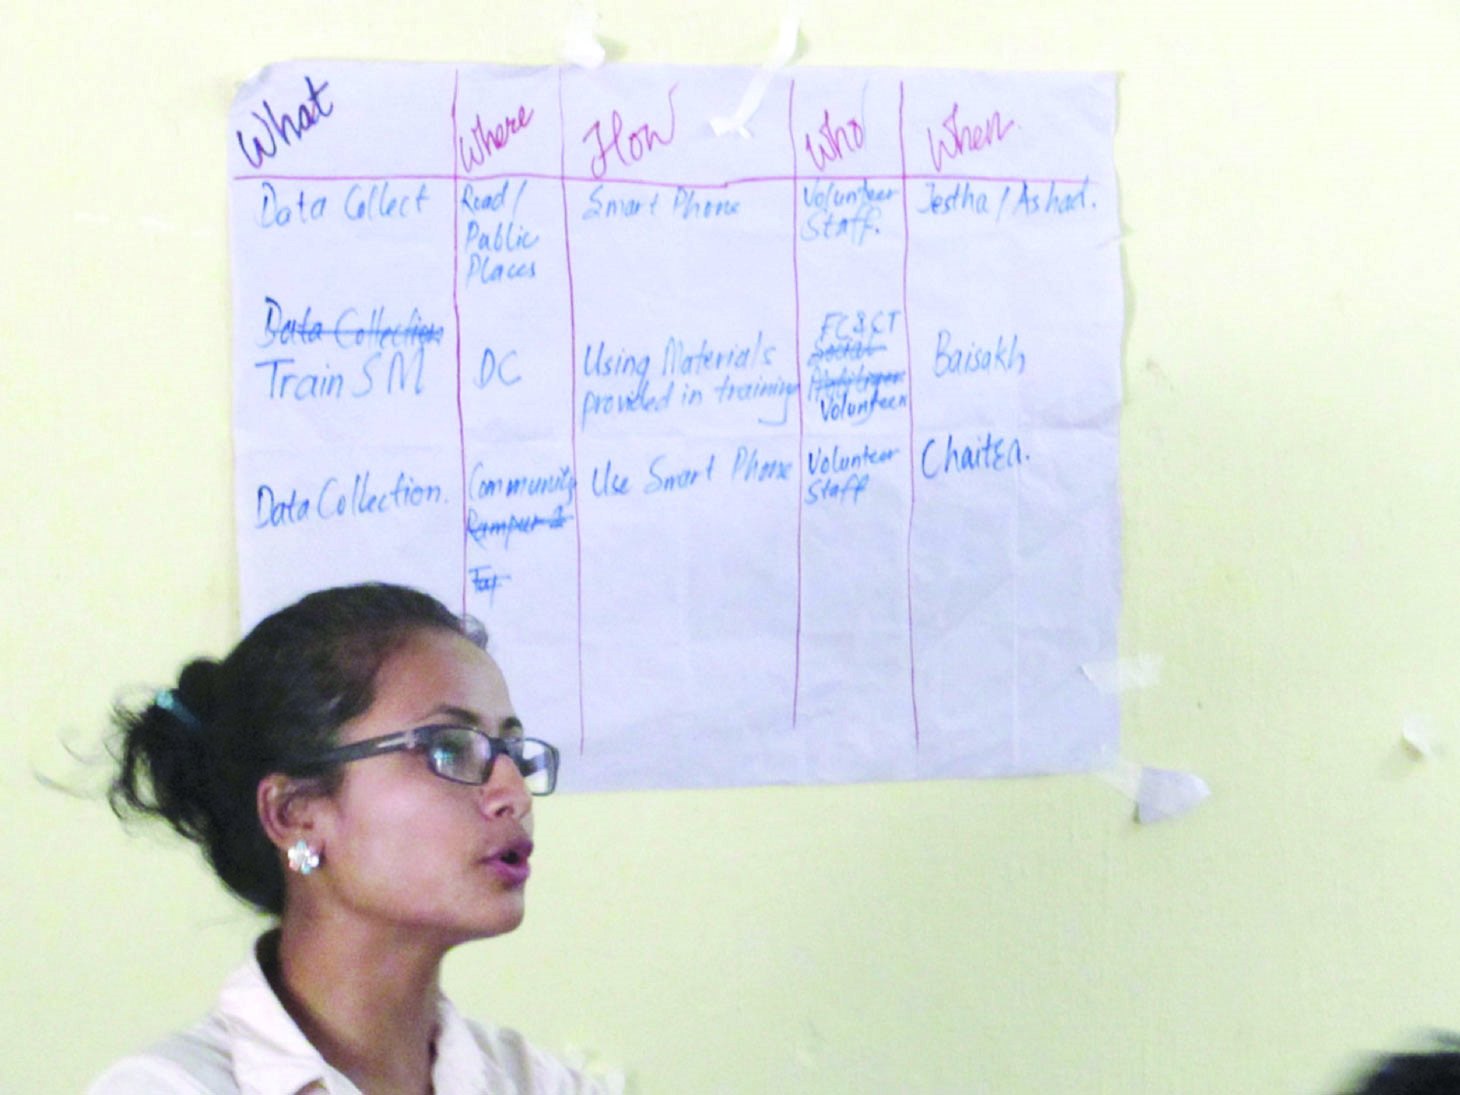
Project implementation
Now that we’ve discussed the planning stage and practical logistics, we will consider the activities involved in setting up and managing a map campaign. This chapter begins with an overview of the field data collection workflow, and its considerations, then explores some typical workflow sequences, and the subsequent activities you will encounter as part of that workflow.
4.1 Field data collection workflow
We will discuss the methodology for field data collection (known as the data capture strategy), project scheduling and daily workflow, quality control, and reporting. A principal consideration in a mapping project is the data capture strategy; how will your team prepare for the field work ahead? How will your mappers go out each day, collect information, come back to the office, and enter it into the OpenStreetMap database? And how will they do this efficiently and accurately? This process requires careful consideration of field mapping procedure, as well as training on the various data collection and mapping techniques planned.
The practical side of mapping campaign has the following common elements, that typically follow this workflow:
- 4.1.1 Define the data model
- 4.1.2 Remote mapping
- 4.1.3 Set up data collection software/forms and quality analysis
- 4.1.4 Field Data Collection
- 4.1.5 Data Review
- 4.1.6 Coverage tracking and QA
- 4.1.7 Export, use and analyse data
- 4.1.8. General Logistical Considerations
4.1.1 Define the Data Model (in more specific terms)
Remember that your data model should include the map features you plan to collect to support the problem statement you developed at the outset of your project (Section 2.2.2 Why are you collecting the Data?). At this stage you should include the detailed attributes/tags about those features that you plan to capture during your fieldwork.
Remember: The data model outlines the geographical features to be collected for the study site, as well as the attributes (or tags) to be collected for those features. At a very basic level, this acknowledges whether the team will collect (for example): buildings, road infrastructure, and waterways, and what attributes, or tags will be collected about those features.
4.1.2 Remote mapping
The project manager will coordinate mapping activities to trace infrastructure in the study area from high resolution satellite imagery in the OpenStreetMap platform. The data created during this task will be used to create orientation maps for field data collection activities. All traced data should be subject to secondary remote validation before the field data collection process. Desktop validation refers to the accuracy of the traced geometry with regard to the available imagery, and any basic tagging that can be inferred from that imagery. Quite often multiple training activities are planned in conjunction with the remote mapping part of the campaign. These can focus on both skills required for the remote mapping aspect, but also, in preparation for the field mapping component.
Remote Mapping Training Activities:
- Staff/Team training on iD-editor, and JOSM platforms.
- Training/Mapathon for volunteers (students, or locals), or city counterparts. These events typically focus on entry level OSM tools, such as iD-editor.
- Mapathons: Mapathons are gatherings that bring people together around the need to create map data. Even if the desktop tracing of infrastructure within the study area is manageable by the project team, it is a good idea to organize a mapathon event to showcase the project, and educate partners on the OSM workflow. A secondary task can be created to demonstrate the tracing procedure).
It is important to consider the logistics for any training event, whether this is for an internal team, or a wider audience. Things to consider are:
- Wi-Fi Capability: Although your training venue may have a wifi connection, you need to test its capacity to accommodate the expected number of attendees. You need to consider using boosters, or hotspots to supplement the wi-fi, or as a backup.
- Computers: Will your facility have machines that you can use, or will you expect your attendees to bring their own? If so, then they will need to bring a mouse, and make sure that they have enough disk space for any installations required.
- Space: What kind of room will be available, and what is the layout? Are there enough tables, and chairs to provide for your expected attendance?
- Power: You will need enough power outlets for charging laptops and other devices. Additional power strips and extension cables are also an excellent idea. In some cases, an additional generator and/or alternate electricity access may need to be secured for duration of workshop.
4.1.3 Set up data collection software/forms and quality analysis
Once data models are completed, they need to be converted into forms to be used in data collection software such as OpenDataKit (ODK), OpenMapKit (OMK), or Kobo Collect that can be used on mobile devices such as phones or tablets. Training on mobile devices and map reading will be required for the survey team. This includes training on the details of the data model (for feature recognition and classification). Creating forms from data models and using mobile data collection tools will be covered later in this chapter.
4.1.4 Field data collection logistics
There are many logistical considerations for the Field Data Collection component of the mapping campaign, these are as follows:
- Stakeholder Involvement: Projects are encouraged to take a collaborative approach to the data collection process, this includes consulting stakeholders on what data is collected, how it is collected, and involving them in the data collection process. For instance, in some projects, students are paired with local residents to collect data. A stakeholder is a group that may affect or be affected by the outcomes of a project. Including locally based stakeholders, such as community members or local students, in the field data collection planning, or, on the actual data collection teams, not only helps the field team with wider community introductions, but also creates opportunity and builds capacity within the participating community. Joining forces makes it easier to keep data relevant and up-to-date and avoids a duplication of efforts. Data becomes more useful and more used when more groups are aware of its existence and involved in its collaborative collection.
- Authorization from district and/or other officials: In many cases, mapping teams will need to carry an authorization letter or other form of permission from local officials to show credibility and to reduce potential conflict that could arise during the field data collection. We recommend that teams request this letter from the appropriate authorities as soon as possible to reduce the risk of delaying mapping activities.
- Pilot Testing: Divide the study area into survey areas that can be covered by a team of 2 in a half day. Test the size of these areas. Train survey team on the survey instrument (device/app/map), conduct small pilot data collection over the course of 1-2 days. Use team feedback to refine the instrument, and potentially the field procedure (including the size of the assigned area). Note: Depending on the climate in your city, it is probably advisable to restrict field mapping to a half day activity, during a cooler period of the day (but during daylight hours). The remainder of the day can be used for data consolidation purposes.
- Field Data Collection Schedule: Following the completion of a pilot test, you should have a stronger understanding of how many buildings or how much area can be mapped in a day. This will allow you to calculate how many days you expect to take for mapping and will allow your team to monitor field data collection process. When creating this schedule - be sure to consider any holidays, density of buildings/features (more dense areas may take longer than less dense areas), weather conditions (rainy season, or extreme hot weather can slow down teams), and other circumstances that could affect this schedule.
- Management of teams in the field: You will need to think about how you will manage mappers in the field. How will you supervise quality of data collected and ensure mappers are fully covering their assigned areas? How will mappers communicate with each other and team leaders when they have questions or concerns? Working in small groups of 3-5 mappers, each with a supervisor often works best for field management. These supervisors will need to regularly check on mappers and communicate with team leaders.
- Safety and Security: For any field operations, the key to effective safety and security management is the creation of a culture of security. Each staff member and volunteer has a responsibility for their own safety and security, and that of other team members. Teams should discuss what risks are posed with field activities, what should be done to avoid risks, and how to mitigate them should they occur.
4.1.5 Digitize/review data (JOSM)
During or after field data collection, teams will review and clean collected data in JOSM. Reviewing the data before upload ensures high quality before it is shared. Following the field data cleaning process, all collected data is cleaned and uploaded to OSM.
4.1.6 Coverage Tracking and QA
Quality assurance and quality control is the process by which mappers check data to ensure that all information uploaded to OSM meets high standards for usage. Quality assurance and control can be and should be performed at all stages of a mapping campaign. Several tools exist to assist with quality assurance during the data cleaning and upload process as well as monitoring data after uploading. These tools will be discussed in Section 4.3.
4.1.7 Export, use and analyse data
Following upload to OpenStreetMap, all data collected during the field mapping is available for individuals and organizations to download, analyze and use for their purposes. Many tools, such as the HOT Export Tool, assist with downloading data from OpenStreetMap. And open source programs, such as QGIS, allow users to analyze and create maps from this data for free. These tools and processes will be covered in later phases.
4.1.8 General logistical considerations
There are many components to managing logistics for field operations. Consider how your team will address the following components.
- Workspace / Meeting space: The need and specifications for a workspace or meeting space varies from project to project. Some field mapping projects require a central base with full-day access and wi-fi whereas other field mapping projects have been operated from campsites.
- Equipment: Different scopes of work will require different types of equipment. For example, ODK and Kobo software can run on most Android devices, but OMK software requires high specifications.
- What type of mobile devices will you use to collect data? (Mobile phones, tablets, GPS devices, etc.)
- Does everyone on the team have access to data collection devices?
- Does everyone on the team have access to computers/laptops? Or will the team plan to work in shifts?
- Transportation:
- How will mappers move around in the field?
- Is the scope of work/area of interest large enough that mappers will need transportation beyond walking?
- If teams/mappers need motorized transportation:
- What types of transportation are available?
- What types of transportation are safe for the context and circumstances?
- Will this type of transportation have associated costs? (i.e. driver fees, rental, fuel)
- Time Management: Effective time management involves setting clear and realistic goals (i.e. how much area each team member should map each day with consideration of fatigue, weather, and other complications), creating checklists and to-do lists (i.e. what should teams do before and after the field each day), making schedules and adjusting behavior when those schedules aren't met, taking regular breaks, and strong communication between team members.
4.2 Designing a survey instrument
In this section we will explore the basics of designing a survey instrument to complement your data collection activities. We will also look at some of the available software and hardware options to deploy your survey in the field.
4.2.1 What is a survey?
From a geographic perspective, a “survey” is a field activity to capture the details of one’s physical surroundings. Usually this involves going out to map at a level of detail that cannot be seen from aerial imagery. This is necessary for creating a detailed and accurate map. The term survey can also apply to the research method for gathering information about the characteristics, behaviors and/or attitudes of a population by administering a standard set of questions to a sample set of individuals. The term survey describes the process itself, while the set of questions - or questionnaire - is considered an “instrument” or "tool".
What is a Survey instrument?
Survey instruments are essentially the tools that allow mappers to collect geospatial survey data in the field. There are a variety of tools to use for field mapping, ranging from paper based (paper maps and questionnaires), to simple GPS, to GPS-enabled smartphones and tablets. Mobile data collection applications such OpenDataKit, OpenMapKit, and KoBoCollect for data collection improve upon traditional GPS and paper-based methods. In many cases, these tools allow us to collect both geographic and attribute data simultaneously.
Most of the application (“app”) based tools featured in this chapter capture the geospatial aspect of the data through either: locally recording the GPS coordinates of the feature in question, and allowing the user to add attribution at the time of recording; or by allowing the user to add detailed attribution to existing features (e.g. buildings, roads, waterways, features of interest) on a digital map, by interacting with that map on a hand-held device while in the field.
4.2.2 Developing survey questions
Whether you plan to use paper based, or digital attribute capture, a questionnaire must be developed that aligns with the data model you have already designed.
4.2.2.1 Good rules of thumb for questionnaires
There are a few simple rules when it comes to developing survey questions. These rules apply even in cases where the expected responses, or data ranges may seem simple, or obvious:
- Keep it simple: A question shouldn’t raise more questions. Questions should be clearly worded. Keep it short and simple, and specific.
- No double barreled questions: Do not ask double-barreled questions. In other words, don’t ask questions that touch on more than one issue but only give one opportunity for one response. If follow-up questions are required for the same map feature, it’s possible to use skip logic. Skip logic creates a custom path through a set of survey questions, that varies based on a respondent's previous answers.
- Do not use institutional or academic jargon: Do not assume the participants (or data collectors) are familiar with your industry jargon. While a term may be frequently used by your organization, or featured in academic literature, it may hold little or no meaning for the general populace. Remember that our survey teams may be drawn from the local population.
- All terms should be clearly defined: If it is important to use specific terms as part of the survey, make sure your training involves a proper definition and description of the term and its usage. This should also be reiterated in either field notes, or as a note that appears with the question.
- No leading questions: Leading questions are questions that subtly prompt the respondent to answer in a particular way. Or, questions that are overly assumptive in their wording, as in: “what level of education do you have?” or, “what job do you have?” You don't know if the respondent has a job, or, if they were exposed to formal education. This is more of an issue when speaking directly to respondents, rather than a situation where a surveyor is making a direct observation about a piece of infrastructure.
- Avoid the use of negative words: Using negative words in questions confuses people. For example: “Did you not?” and “Do you not?” This is leading and already assumptive of the answer. Ask something in a clear fashion that allows for an unbiased yes/no answer.
- Do not use biased, or emotionally charged terms in your questions: It is good to check your terms and wording choice with a community representative before going into the field.
A clear set of instructions, and adequate training is always required if the surveyors are filling out the questionnaire alone, or, it will be administered by someone other than your immediate research team. It is important to pilot test the product, and cross check your survey with a member of the local community. You have to remember that there are potentially two levels of interpretation here: your surveyor, and the person being surveyed (if that is relevant for the data being collected). That creates at least one, if not two chances for misinterpretation.
4.2.2.2 Question response style
Closed questions provide a list of acceptable responses. Checklists, multiple choice questions, true/false questions, and sliding scales are all types of closed responses. Respondents or surveyors may find it easier to answer the question when response alternatives are provided, and it is easier and less time-consuming to interpret and analyze these types of responses. The answers generated using this style of question can be useful to generate statistics and are easier to interpret and analyze, but they lack detail, richness and personal viewpoints. Closed response questions are critical for adhering to Data Models for GIS database construction. Using multiple choice options keeps tagging consistent, and one can always include an “other” option, to allow for flexibility.
Open-ended questions allow respondents to answer in their own words. There are several advantages to this; respondents may give increased amounts of reflection to their answers, and critical unanticipated perspectives may emerge. Sometimes, answers to open questions may be difficult to interpret and answers may be spread over many categories, making them hard to analyze. For the purposes of feature identification, open-ended questions make proper categorization almost impossible, and the inclusion of an “other” option at the end of a closed range of choice is a good middle ground.
4.2.2.3 Data collection workflow
The data collection process starts by translating data models into forms that can be read by data collection software such as OpenDataKit or KoboCollect. For each software type, this process can look different - either building xlsforms in spreadsheet software or using online builders. Once completed, these forms are uploaded onto mobile data collection devices. In the field, mappers open the applications when reaching a feature they want to map. The geospatial and attribute data is collected and saved to the device. After data collection, teams review data in JOSM before uploading to OSM. Kobo provides an additional environment where teams can aggregate and analyze the raw data on the Kobo Toolbox.
Your choice of workflow, and the tools associated with it must meet your resources. If a heavily digital workflow exceeds your hardware budget or the training potential of your volunteers, then you need to plan accordingly. Mapping workflows can be exclusively paper-based (e.g. Field Papers, and paper questionnaires); a combination of paper and digital (e.g. Field Papers and a data collection app, or GPS); or, an exclusively digital workflow (e.g. OpenDataKit/OpenMapKit). There are pro’s and con’s to each combination, ranging from: cost, to ease of setup and training, to error reduction and quality control.
Type 1: Paper based workflow
For the collection of OSM data, a paper collection workflow typically involves the use of a Field Papers Atlas (to verify the existence and positioning of mapped features in the field), and a paper questionnaire to collect the attribution for the mapped features. Pros:
- Ease of training
- Limited technology required
- Relatively easy to set up and begin mapping
Cons:
- High amount of data entry required after data collection
- Higher margin of error/lower accuracy of data
- Possible limitations on quantity of data that can be collected
Type 2: Paper-based & Digital Workflow
A Paper + Digital workflow typically involves the use of a Field Papers Atlas and GPS device, recording waypoints with a GPS device and recording field data on paper for later reconciliation on computers for quality control and upload to OSM.
Pros:
- Ease of training
- Lower need for technology access
- Relatively easy to set up and begin mapping
- Fewer limitations on quantity of data that can be collected
Cons:
- High/moderate amount of data entry required after data collection
- Moderate margin of error/moderate accuracy of data
Type 3: Exclusively Digital Workflow
An exclusively digital workflow relies exclusively on mobile devices (i.e. phones, tablets) for field data collection, which can be directly transferred to computers for quality control and upload to OSM. This workflow can take a number of forms:
- ODK or Kobo Collect only
- OpenDataKit + OpenMapKit
- QField
An exclusively digital workflow can have the following pros and cons depending on applications used:
Pros:
- Lower margin of error/higher accuracy of data collection
- Higher quantity of data that can be collected
- Reduced data entry/quality control necessary after data collection
Cons:
- More intensive/difficult training
- Access to technology required for processes
- Set-up can be labor/skill intensive
4.2.2.4. Popular Digital Tools
- Open Data Kit (ODK) is a free and open-source set of tools which help organizations author, field, and manage mobile data collection solutions. ODK Collect is part of ODK and is an Android app that replaces paper forms used in survey-based data gathering. It supports a wide range of question and answer types, and is designed to work well without network connectivity. Forms can be created using spreadsheet software (such as Excel or LibreCalc) or using the ODK Form Builder.
- OpenMapKit (OMK) is an extension of ODK Collect that launches directly from within ODK Collect when the OSM question type is enabled in a standard survey. It is what allows you to browse OSM features, and to create and edit OSM tags. The main difference between ODK and OMK is that OpenMapKit allows users to tag polygons, such as buildings, that already exist in OSM instead of only being able to add data to GPS points. Forms for OMK are slightly altered from ODK forms to incorporate the OSM tagging scheme and need to be built using spreadsheet software (such as Excel or LibreCalc).
- KoBoCollect and Kobo Toolbox is in almost all ways similar to ODK Collect, and is built on top of the ODK platform. Forms can be created through an online form builder. KoboCollect includes a dashboard for analyzing and managing data to create maps and reports.
- QField is the mobile accompaniment to QGIS, which allows you to take your QGIS projects from the desktop environment to the field. It is GPS centric, and QGIS desktop compatible; project preparation can begin on the desktop version. It is fully operational offline, but with synchronization capabilities. Users can add new points to an existing database, or edit the attribution of existing features (points, lines or polygons). QField is an Open Source project and the source code is available on GitHub.
- Maps.Me is a mobile application that allows users to use and navigate OpenStreetMap offline. In addition to navigation, users can use Maps.Me to collect data and upload to OSM when connection allows. Maps.Me limits OSM additions to point data and has a limited selection of tags that can be entered.
4.3 Quality Assurance and Quality Control
Quality Assurance and Quality Control (also known as data cleaning) is the process by which mappers, and OpenStreetMap contributors in general, check data to ensure that all information uploaded to OSM meets high standards for usage and to prevent vandalism. As OpenStreetMap is a free and open platform that anyone can use and edit, it is critical to the sustainability of open data and OSM that everyone participates in the quality assurance and quality control process – from field data collection, to data cleaning, to long-term maintenance of existing OSM data.
While Quality Assurance and Control can be and should be performed at all stages of a mapping campaign, we will explore several tools that assist with quality assurance and the data cleaning/data upload process following field data collection. These tools are also useful for monitoring data after upload, by helping validators find and fix common issues such as:
- Misspelled or improperly formatted place names
- Incorrect tag usage
- Overlapping or doubled buildings
- Roads and footpaths not connecting to a road network
- Objects with a name that should be in another key (i.e. trees, buildings, etc)
4.3.1 Quality control process (post-field data collection)
The quality assurance and quality control process is a team effort, with many roles and responsibilities. Individual mappers should check their data, for example, by adding field data files to JOSM, syncing with existing OSM data, and then going through field data to check for errors before uploading to OSM. While all mappers are checking their data, it is important to assign a team member experienced in JOSM to focus on checking the contributions of others for any missed errors and to provide feedback on their data quality checks. This feedback is especially important for mappers new to using JOSM so that mistakes are caught early and mappers can improve their quality assurance skills.
The process of reconciling field data with OSM data depends on the workflow type selected for field data collection. There will be some extra steps, and precautions necessary, depending on the combination of tools used.
4.3.1.1 Paper workflow
With a paper-based workflow, the information collected in the field will have to be manually entered into OpenStreetMap. This might include uploading Field Papers so that any field notes and modifications to the map can be transferred to OSM. If additional paper surveys or maps were used to capture attribute/tag information about the mapped infrastructure, then teams will need a reliable workflow to incorporate this data. A paper workflow is quite manual, and subject to human error, therefore teams working in this way need a data reconciliation workflow that includes rigorous checks and oversight, by advanced team members.
4.3.1.2 Paper + Digital Workflow
For mixed workflows, mappers will face some of the same considerations outlined for the paper workflow, but in addition, they may need to upload collected GPS points into JOSM and download data from OSM to merge the data sources. If point data was collected for polygon features in OSM (i.e. building information was recorded with corresponding GPS points), these tags will need to be copied and pasted to the existing polygon before deleting the nodes.
4.3.1.3 Digital workflow
The digital workflow requires mappers to open field data files in JOSM and download data from OSM to merge the data. If point data was collected for polygon features in OSM (i.e. building information collected as points in ODK), these tags will need to be copied and pasted to the existing polygon before deleting the nodes. If mappers use digital survey apps, such as OpenDataKit or Kobo Collect, that don’t sync directly with the OSM data model (in the same way that OpenMapKit does), then they will need to establish a data reconciliation workflow to transfer any OSM relevant data to the platform. Although these are all digital tools, reconciliation of data collected in this way isn’t simply automatic.
4.3.2 Quality control tools in JOSM
There are tools built into JOSM, as well as additional plugins that can assist with data quality control during the upload process. (Some of these can also play a role in the validation process following remote mapping activities).
- Filters is a built-in tool that allows you to disable, hide, select, and highlight specific groups of objects based on flexible custom parameters. This tool will help you to spot and avoid common mistakes, and review data.
- The Validation Tool is another built-in tool that will review and search for common errors as well as provide warnings about potentially problematic data.
- The Todo List plug-in allows users to systematically review data that is to be uploaded, and monitor progress of data cleaning work. The “Todo List” plug-in needs to be downloaded before it can be used. Visit this page to learn how to install plug-ins in JOSM, then download the “Todo List” plug-in.
- MapCSS Paint Style is an advanced JOSM quality assurance tool that can be used to visually identify errors such as missing tags and road network issues. Existing MapCSS Styles can be imported or with some training, quality control teams can create their own MapCSS styles that match their data model.
4.3.3 Monitoring Upload Quality: OSMCha
OSMCha, or the OpenStreetMap Changeset Analyzer, is a tool designed to review uploads and changes to OSM data, largely to prevent bad edits and vandalism to map data. This tool allows users to filter by username, location, dates of upload, and other metadata features. OSMCha is useful for monitoring the progress of data cleaning and upload teams.
4.4 Field Etiquette
When working in the field, be polite and engaging with residents and other people you may encounter. It's important to consider how you would feel if a stranger approached your home to collect information. Make sure to introduce yourself when someone is present and briefly explain your purpose for being in the area before beginning to collect data. It can even help by showing those that are interested how you are collecting data and the tools that you are using.
Carrying a permission letter from an appropriate authority can relieve tensions that may arise. In addition to carrying a permission letter, field mappers should dress professionally (although appropriate for field work), and if possible, wear designation such as matching vests, hats, or at minimum, have identification badges. If there is concern from local residents as to your presence, be calm and patient. If a discussion escalates, safely remove yourself - it's better to not collect data than to create a safety issue or lose the trust of local residents.
Prior to entering the field, it can be helpful for field mappers to practice introducing the project and their purpose with each other, as well as practicing handling scenarios with reluctant or difficult community members.
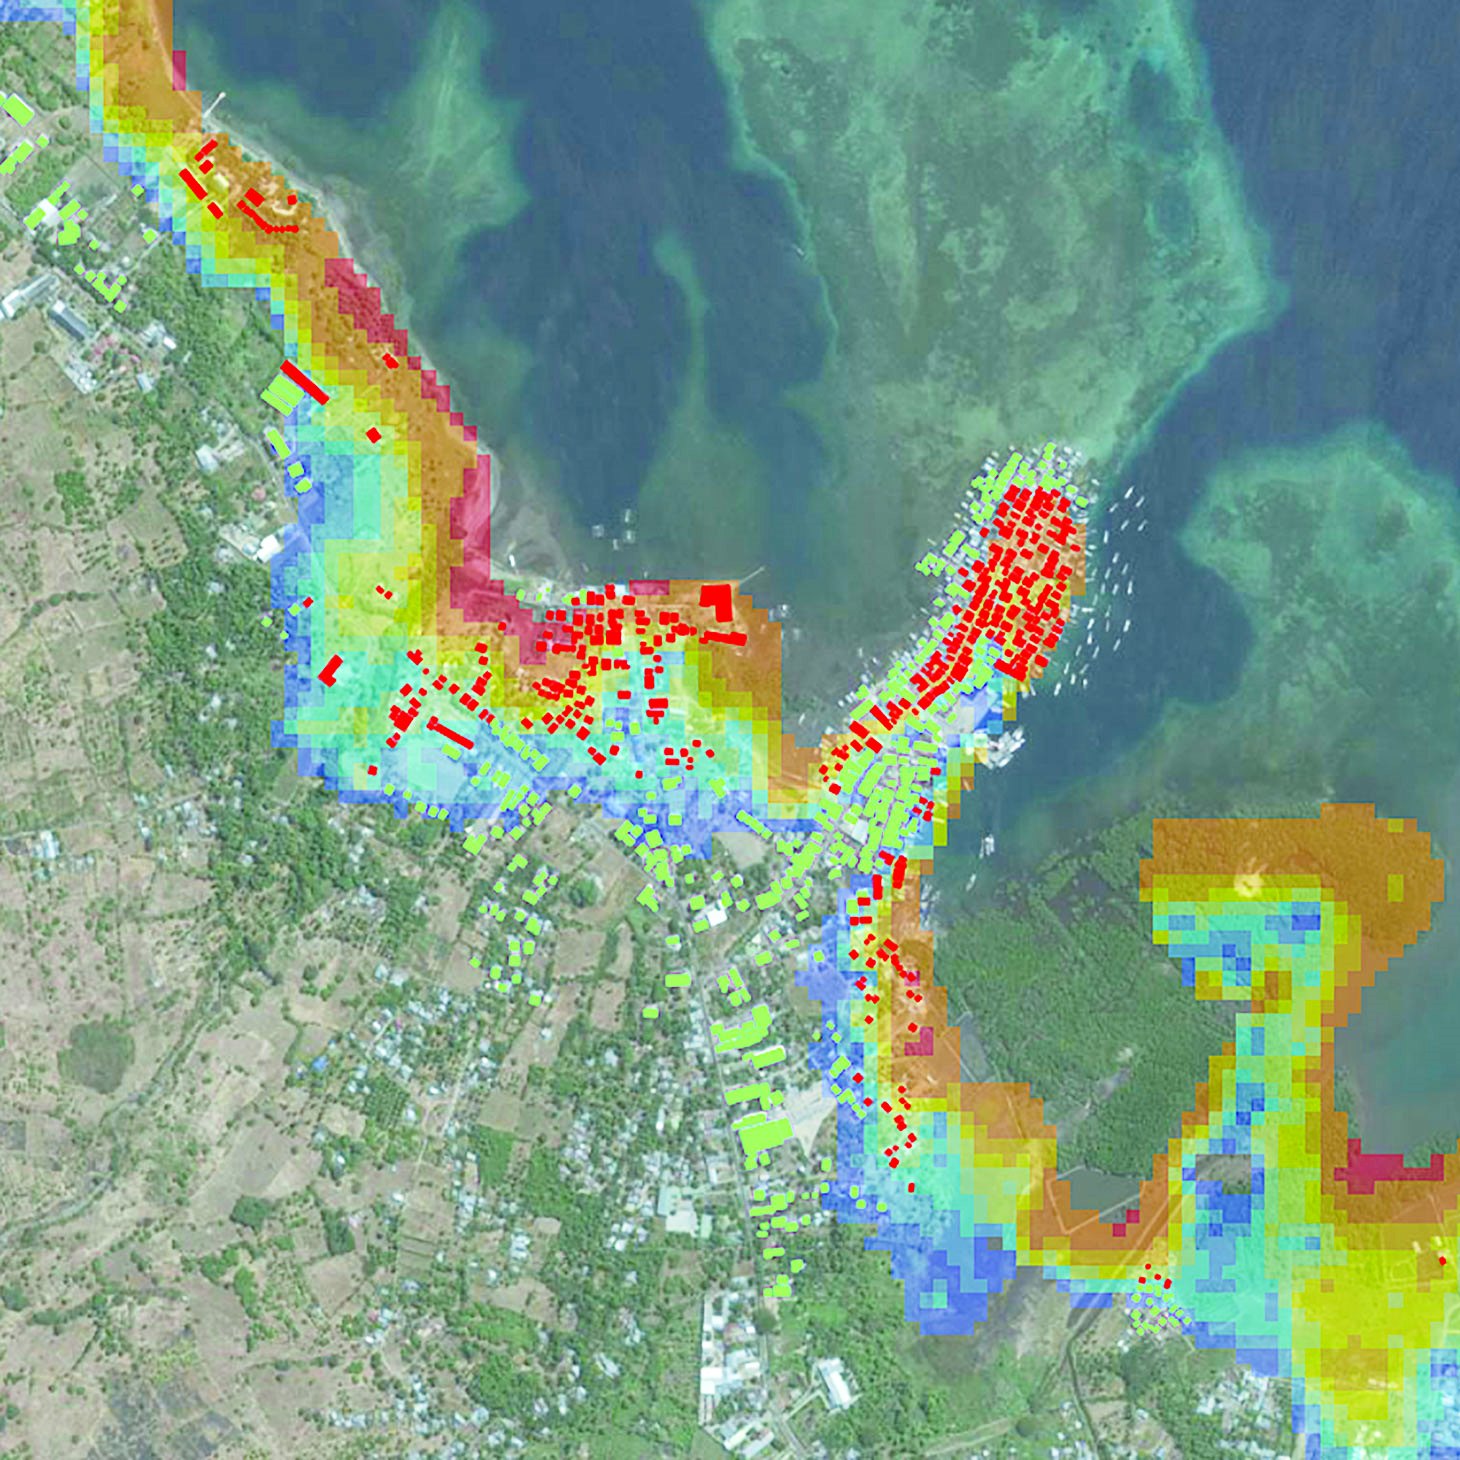
Lessons learned and recommendations
The preceding sections took a practical look at how to plan and implement a mapping project. Open Cities is ongoing, and improved methodologies and knowledge come out of each successive project. In this chapter, we conclude by highlighting several key lessons learned from the design and implementation of previous Open Cities initiatives.
5.1 Government ownership
Although many partners and participants in an Open Cities project will be from civil society and the private sector, it is critical that government counterparts be involved in a project’s development and execution. Governments are primary stakeholders for many disaster risk management and urban planning projects, and they provide necessary legitimacy to Open Cities work.
In Kathmandu, the involvement of the Department of Education helped to build their confidence in using the data to prioritize seismic retrofitting activities. The mapping team carried an official letter in support of the project, which was also critical to their ability to gain access to schools and health facilities to conduct surveys. In Sri Lanka, local government authorities were directly involved in the mapping activities to ensure government ownership and use of the data. Key national agencies were regularly briefed and consulted.
Involving government in this way also makes it easier to adopt a systematic approach to mapping, and it makes it easier to obtain existing data sources for mappers in areas that may not have many other partners to engage. Engaging governments early in the planning process and ensuring close involvement throughout is an essential component of a successful Open Cities project.
5.2 Partnerships with universities
Universities have been valuable allies during continued Open Cities work. Outreach to university departments in engineering, geography, computer science, and planning provided critical connections and support to Open Cities projects. Students from universities’ technical departments frequently have the proper technical backgrounds to quickly learn OpenStreetMap. In both Dhaka and Kathmandu, university students have played important roles in mapping activities and software development. Some universities also require students to complete internships or volunteer projects before graduation, which led a number of students in Kathmandu to participate in Open Cities.
University faculty members have also provided useful support. In Dhaka, professors from the civil engineering and planning departments at Bangladesh University of Engineering and Technology (BUET) provided necessary input into the design of the mapping project. Professors in Kathmandu University’s geomatics department have provided guidance to the project on quality control techniques for surveying and have incorporated OpenStreetMap into their courses. Training future classes of university students will help the OSM community in Kathmandu continue to grow after the formal project period has ended.
5.3 Access to imagery
As shown in the OpenStreetMap community’s post-earthquake work in Haiti, access to high-resolution satellite imagery is extremely useful for efficient mapping of infrastructure. Fortunately, the coverage and quality of imagery available on OpenStreetMap through providers such as Bing, Digital Globe, Mapbox and ESRI, is steadily increasing, making free access more realistic and reliable for global mapping projects.
In certain locations, imagery can still be inadequate, expensive, or only available under licenses that would prevent digitization by the public.
With this in mind, the U.S. Department of State’s Humanitarian Information Unit (HIU) launched an initiative in 2012 called “Imagery to the Crowd.” This program makes high-resolution imagery— purchased by the U.S. government from providers such as Digital Globe—accessible to humanitarian organizations and the volunteer communities that support them. Open Cities Kathmandu partnered with USAID and Imagery to the Crowd to release 2012 satellite photography for the Kathmandu Valley and to organize volunteers in Germany, Nepal, the United Kingdom, and the United States to digitize building footprints. The data created by these volunteers have been incorporated into USAID disaster response planning, providing a solid foundation of data upon which the Nepali OSM community can continue to expand and improve.
OpenAerialMap is another valuable open service, providing access to a steadily growing catalog of openly licensed imagery and map layer services.
5.4 Community connections
OpenStreetMap and many of the other tools discussed in this toolkit have global networks of users, software developers, and knowledgeable experts who interact and share best practices through listservs, in-person conferences and meetups, and other forums. Connecting participants in Open Cities projects to these communities can be a rewarding experience for them and provide valuable access to a global knowledge base.
As part of the Open Cities Kathmandu project, the local team helped to organize a number of events commemorating International Open Data Day in February 2013. The day’s activities included a “mapathon” in which teams worked together to digitize building footprints in the Kathmandu Valley. Local groups were connected to international volunteers, and, together, all participants mapped over 8,000 buildings in a single day. The local team also established important relationships with experienced OSM contributors who have provided significant support to the growing community in Kathmandu. In addition, the Kathmandu community helped digitize information into OSM after the Typhoon Yolanda hit the Philippines in November 2013. These relationships are an important factor in OSM’s global success, and project designers should seek opportunities to support them through Open Cities work.
5.5 Building trust in the data
Data quality is a frequently raised issue in community and volunteer mapping projects. The Open Cities Project has taken numerous measures to ensure that partners and intended users of the data would trust its accuracy and completeness. In Kathmandu, partner organizations including the National Society for Earthquake Technology (a respected NGO working on seismic resilience) and the Kathmandu University Geomatics Department provided technical guidance to the project as well as independent quality assessments throughout the process. In Dhaka, key stakeholders including BUET and representatives of government and civil society were consulted throughout the project, and many of them received basic trainings in OpenStreetMap to familiarize them with the platform.
5.6 Sustained engagement
Finally, it is important to note that, for these projects to be successful, sustained engagement with local partners is necessary. Too often, technology and data projects of this sort are discrete, short-term endeavors. A workshop or a weeklong training course is simply not enough time to effect the kinds of shifts that Open Cities hopes to support.
Although OpenStreetMap makes mapping more accessible to non specialists, it doesn’t change the fact that collecting and using geographic information is a complex technical undertaking that requires more training and involves a longer learning process than many people assume. Building technical communities of OSM mappers and software developers who are familiar enough with the platform to comfortably deploy it in their own tools and applications also takes time, but such community building is integral to the sustainability of Open Cities projects.
Finally, Open Cities seeks to contribute to cultural and policy shifts within technical groups and government bodies that prioritize open data and broad participation in development challenges. When planning these kinds of projects, it is important that the parties involved understand and commit to sustained investment in their success.
Case Studies
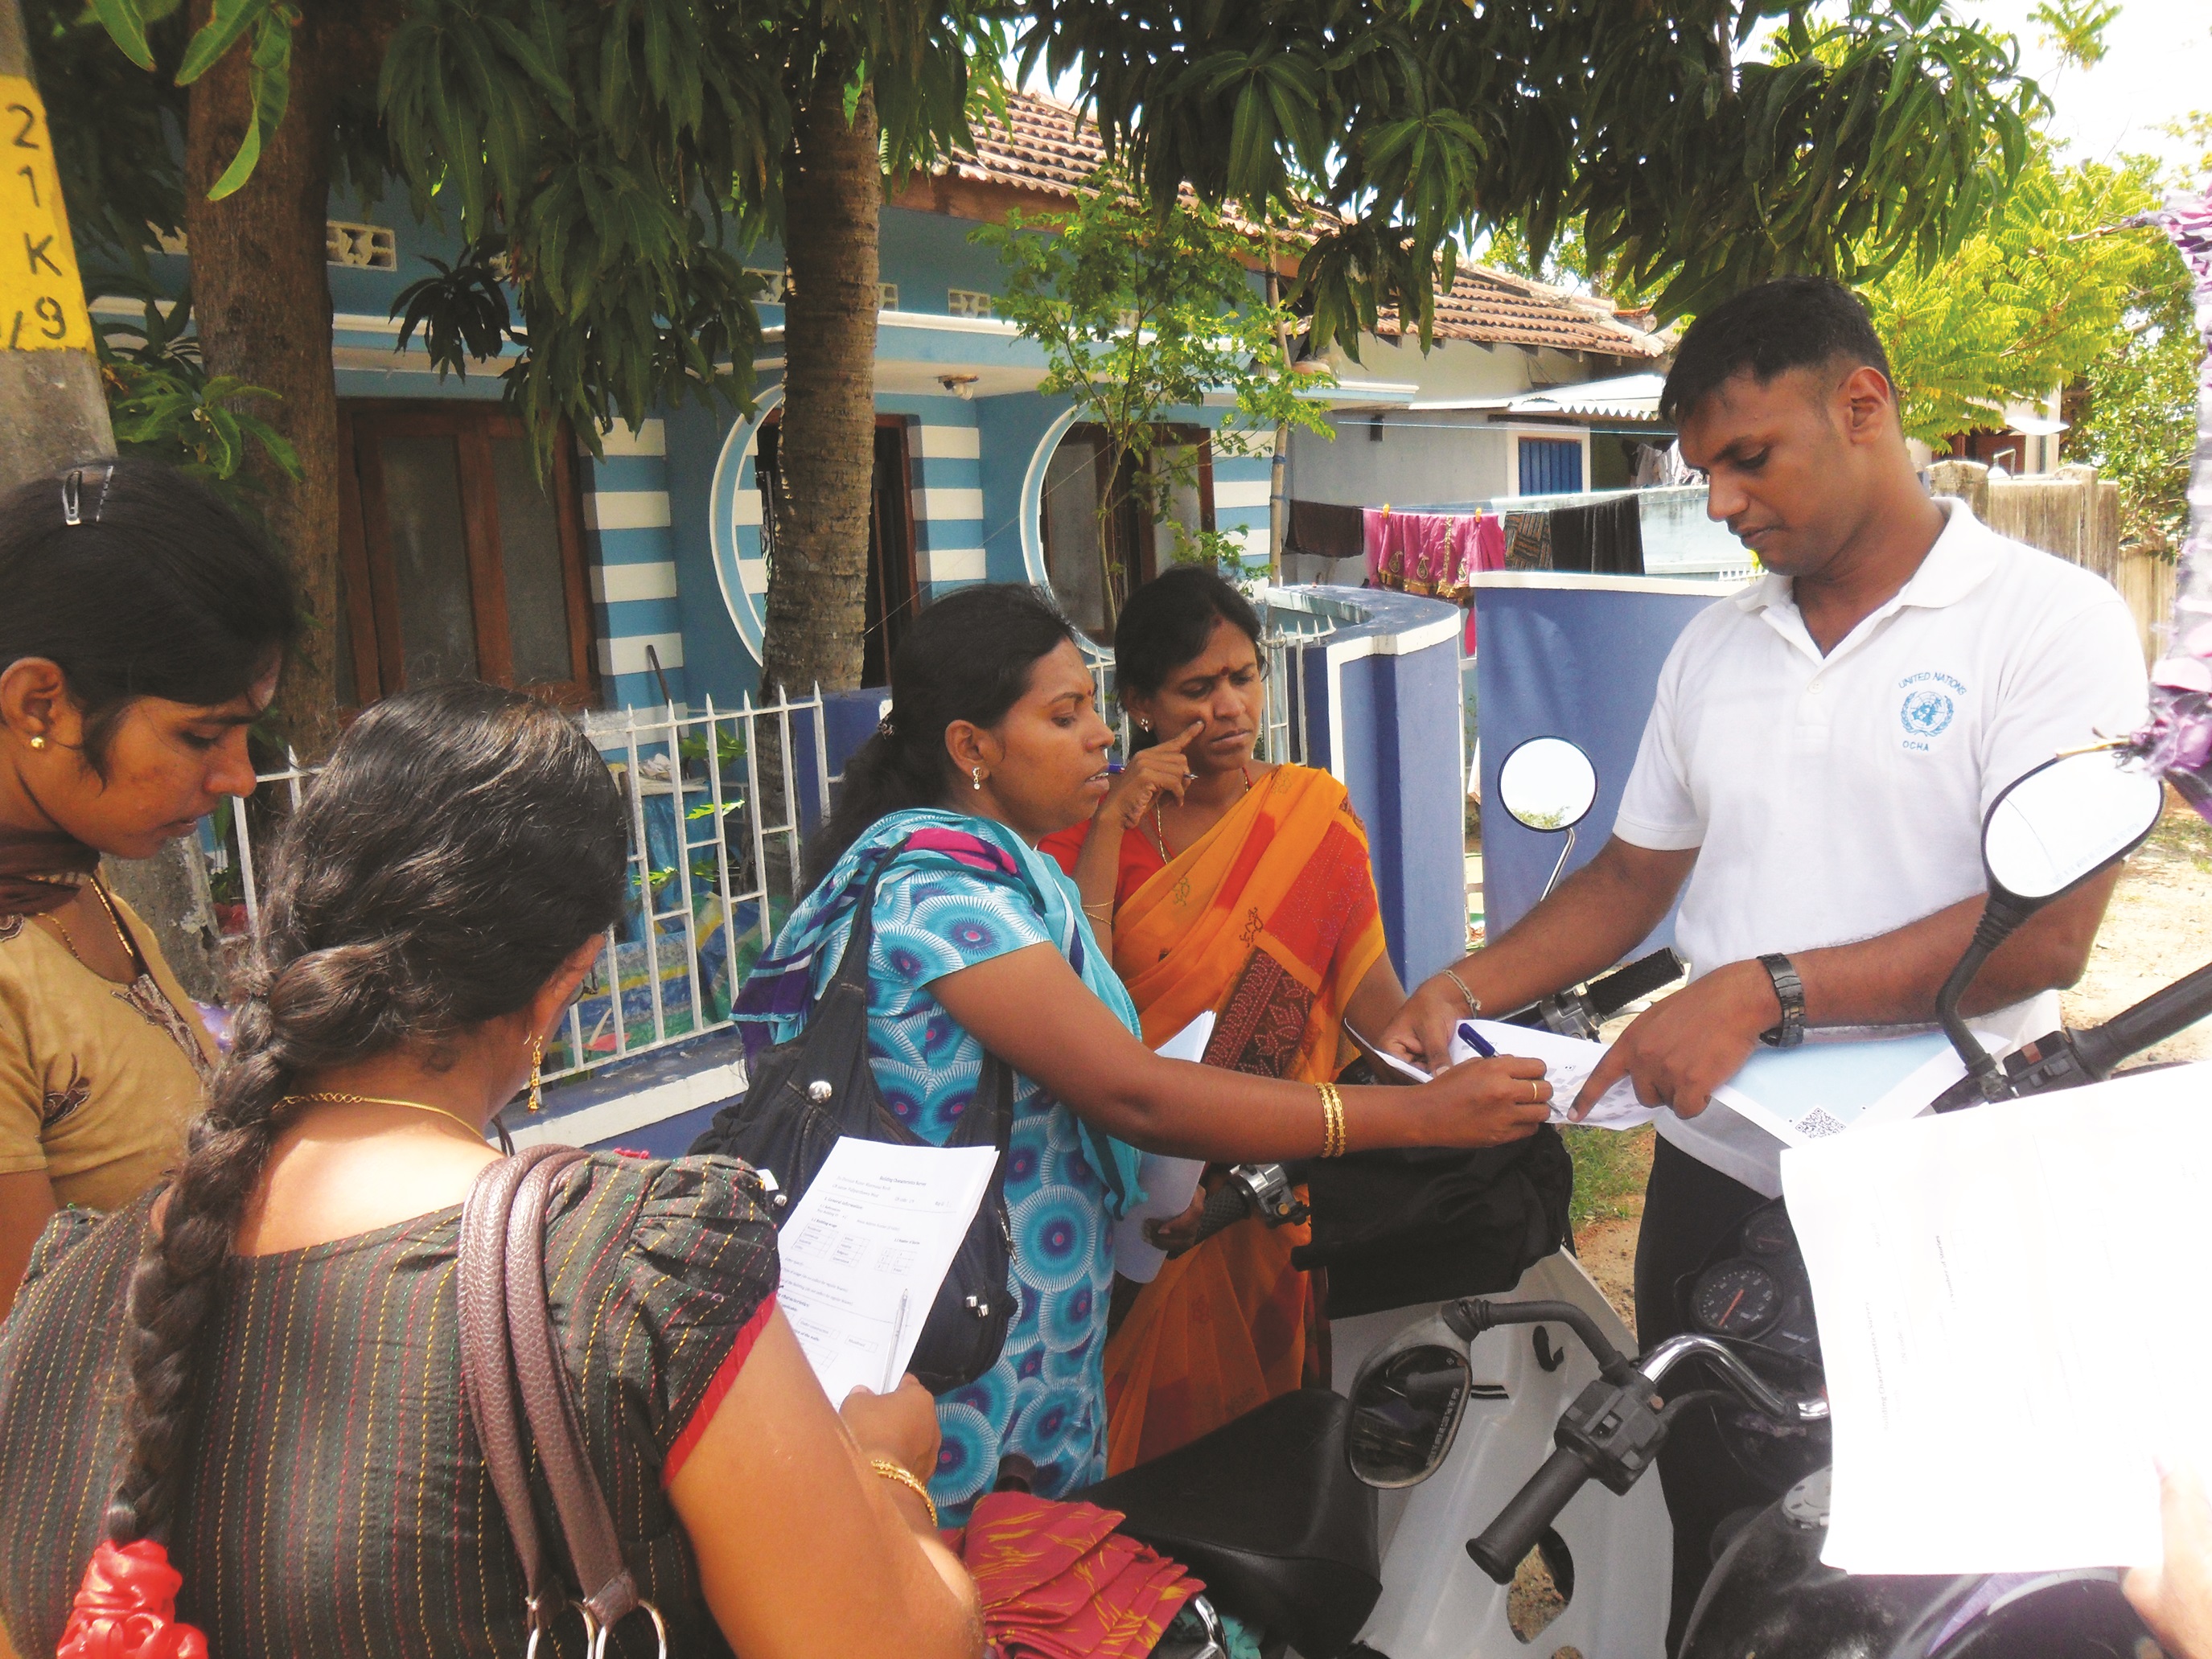
Batticaloa, Sri Lanka
Overview
Batticaloa, a major city in Sri Lanka's Eastern Province severely affected by the Sri Lankan civil war and the 2004 Indian Ocean tsunami, is located in a hazard-prone area that has suffered near-annual droughts, floods and cyclones. Some limited hazard maps were available for the area, but no detailed digital geographic data of the built environment were available for use in risk studies or for informing contingency and response planning, potential infrastructure and risk mitigation projects.
Scope of Work
The objective of the Open Cities project was to map the complete building stock including critical assets and road infrastructures of the Manmunai North Divisional Secretariat, which covers an area of 68 km2 and includes about 90,000 people around the town of Batticaloa. The characteristics collected focused on basic information necessary for vulnerability assessment including number of floors, usage, and construction materials of walls and roof.
Partners
National Government — Several national government agencies including the Disaster Management Center, the Survey Department and the Census Department were involved from the beginning in the design of the project. Along the course of the project, the key national agency were updated on the progress and results of work. These partnerships provided the OpenCities with a strong country ownership, an important credibility, and a legitimacy to interact with the local government. The national agencies also provided staff from the local offices to support the project and build their capacity.
Local Government — Locally, the work began with a series of meetings with the Batticaloa local authorities. In part, these were designed to establish the close collaboration needed to carry out the actual mapping. They were also meant to ensure local understanding of and trust in the mapping process and in the data produced, so as to encourage local authorities to use the tools and data for their own DRM and urban planning projects.
Humanitarian OpenstreetMap Team (HOT) — HOT provided some remote support to the team and facilitated a national workshop on OpenStreetMap at the end of the project to spread the word about OSM and build the capacity of key national agencies in order to start scaling up the project in Sri Lanka.
Universities — The project was presented to most of the professors of the key departments in the main Sri Lankan universities (University of Colombo, University of Peradeniya, Sri Lanka Institute of Technology, University of Moratuwa, University of Sri Jayewardenepura, Eastern University). Some of the professors participated in the national OSM workshop held by HOT. A small amount of mapping parties were held however as the location of Batticaloa is very far from most universities, the students were not involved directly in the data collection for this phase but will be involved in the next phase of the project.
Building the Team
A team of four technical experts (three recent GIS and IT graduates and one experienced GIS analyst) was hired and trained in OpenStreetMap techniques in order to supervise and support the overall mapping process. The team was completed by the staff from local partners, including the Batticaloa Municipal Council, the Batticaloa District, the Manmunai North Divisional Secretariat to constitute a team of about a dozen person fluent in OSM. For the field survey, the core team worked with the 48 recent university graduates that had been recently hired to work on the local planning and development of the 48 Grama Niladhari that make up the Manmunai North Divisional Secretariat. The graduates were appointed by the District Commissioner to work on the Open Cities project and received a stipend for the extra work.
Workspace
It was initially planned to host the team in the Manmunai North Divisional Secretariat premises but due to space, time and connectivity constraints, the team rented a house in Batticaloa that was used as a headquarter. It was set up with computers, internet connection, printers, tables, bedrooms in order to provide a space for trainings and to process field data.
Existing Map Resources
The team found an existing dataset for building footprints on the eastern coast. However, after examination, the quality was poor as it had been generated by automatic extraction so it was decided not to use it. Some datasets existed for infrastructures like schools and roads but they were not cleared for use in OSM and outdated. Therefore, no pre-existing digital data was used in the project. However, the team worked with Divisional Secretariat and each GN divisions as they maintained paper maps for each of the 48 GN divisions. A booklet with all the paper maps were shared with the team and used to add landmarks and street names to the initial base map.
Data Collection
A small group began by tracing all building outlines into OSM using satellite imagery and then added landmarks, roads and road names, and points of interests using local paper maps provided by the divisional secretariat. This effort created a solid reference map for the surveying work. The work was then split into two components: buildings were surveyed by the 48 recent graduates, and surveyed data were entered by the core team who were also responsible for fixing the maps and refining the point of interests. Both groups were trained in OSM and surveying techniques by the Open Cities team.
Quality Control
Several measures were taken to ensure the data quality and ownership. First, the team worked with the local Building department, the Batticaloa Municipal Council civil engineer, and a civil engineering professor from the University of Moratuwa to create the building survey and ensure that it is usable by non-expert and taking into account local building practices. Second, the local team did ongoing quality assessment by doing a re-surveying of a sample of buildings for each GN divisions, making sure that the surveyors were not making mistakes. If some errors were found, corrective actions would be taken right away to ensure the rest of the data would be correct. Third, the team ran queries on the database to identify anomalies in the data collected and accordingly made fixes and took corrective actions through extra training. The trust and ownership in the data was ensured by the multiple partnerships with the national and local government and engaging through regular updates and feedback loops through the different phases of the project.
Results
Footprints and basic characteristics including number of floors, usage, and construction materials of walls and roof was collected for all 30,000 buildings in the area. These data are now freely available in OpenStreetMap and in the government geospatial data sharing platform RiskInfo (www.riskinfo.lk) for easy use by many stakeholders. At the local level, a wrap-up ceremony was held with all the stakeholders and participants where A3 maps were given to each GN division and T-shirt were handed out to all the participants. Future plans were also discussed including the request to extend the project to other DS Divisions in the district and to link the household survey recently conducted (150 questions per household) with the geographic data. To publicize the benefits of these techniques at the national level and promote their adoption, high-level managers of the relevant national agencies were briefed regularly and given final results when available. Two week-long training courses, one dealing with OSM techniques and the other with use of data for decision making (specifically the combination of data with existing hazard maps through GIS tools and the InaSAFE tool) were conducted at the national level with all relevant national agencies. Discussions are ongoing with various ministries concerning the next phase of the project. A second phase of the project will take place to cover the flood prone Attanagalu Oya river basin near Colombo. There is also strong interest in scaling up the project to cover a greater geographic area, in using OSM to update the Survey Department data, and in streamlining the use of the data in more DRM applications and sectors.
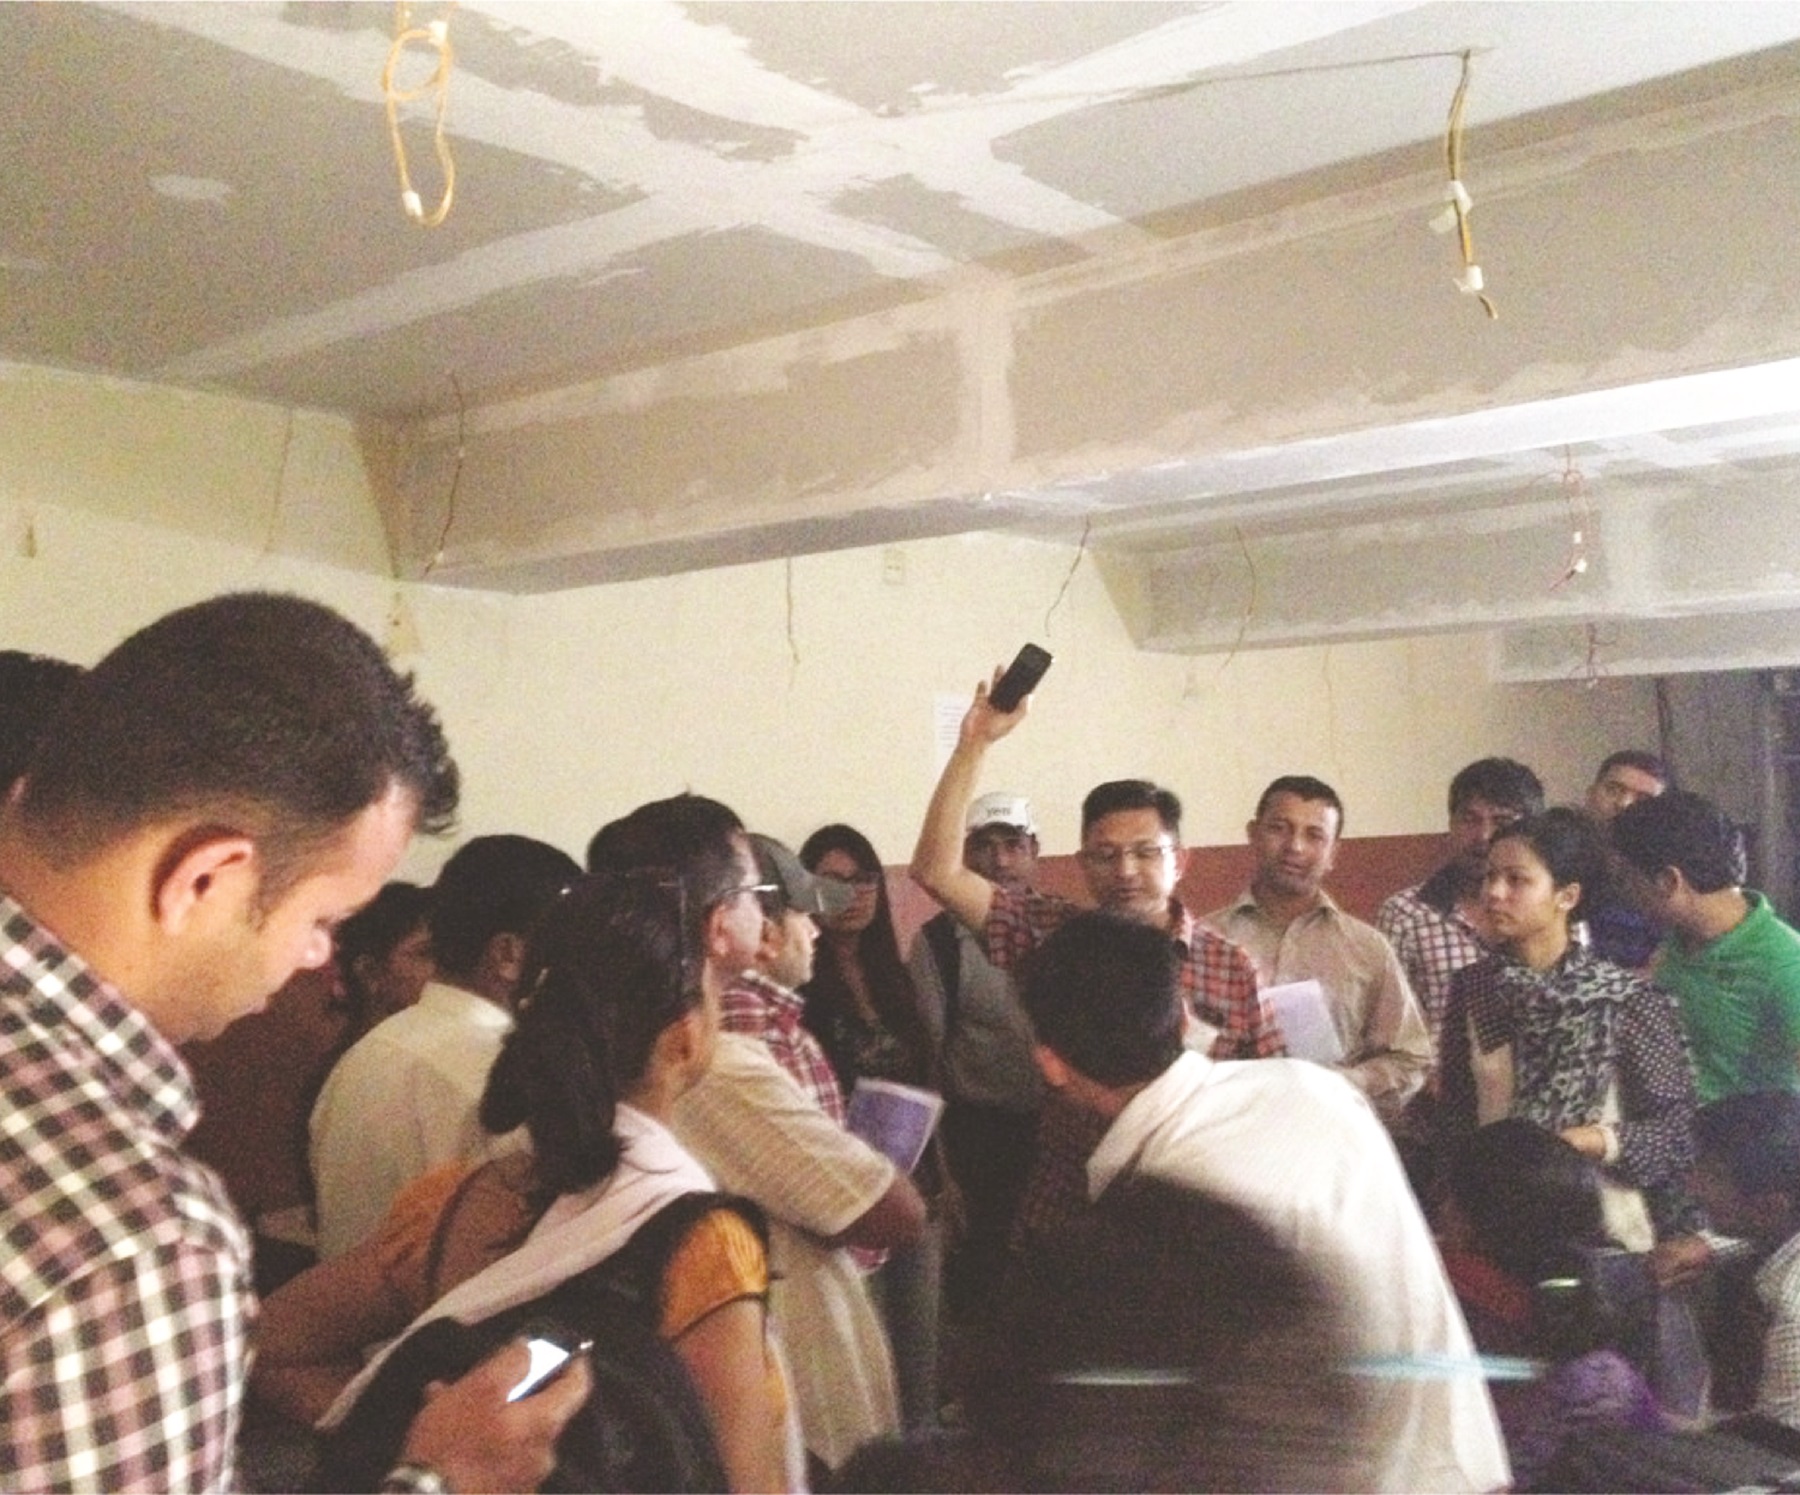
Kathmandu, Nepal
Overview
Kathmandu, the capital city of Nepal, is the most seismically at risk city in the world in terms of potential for loss of human life during a major event. In November 2012, in partnership with the government of Nepal, the World Bank and GFDRR launched a project to build seismic resilience in the Kathmandu Valley’s education and health infrastructure, in part by creating a disaster risk model to determine the relative vulnerability of the relevant buildings. Once complete, the model will be used to prioritize plans for retrofits of schools and health facilities to improve structural integrity in the face of earthquake.
Scope of Work
The mapping goal for Open Cities Kathmandu was to collect data on location, occupancy, and structural characteristics for all of the schools and health facilities in the Kathmandu Valley.
Partners
Government — The Nepal Department of Education is a key partner in Open Cities Kathmandu. They are leading the risk assessment project to which the mapping work will contribute. In addition to institutional support, the DOE also provided a letter of support that mappers carried with them as part of the work, instrumental to gaining access to some of the facilities.
Technical Agencies — NSET, the National Society for Earthquake Technology, is a Kathmandu-based NGO with significant seismic risk and engineering expertise. They supported the project through assistance with data modelling, providing training on structural assessments to the mapping team, and conducting quality assessment of the data throughout the process.
Universities — Universities were critical partners in the project. Connections to the Geomatics and Engineering departments in Kathmandu University and Tribhuvan University assisted with finding the core team and volunteers for the project and helped provide technical guidance and quality control during key project phases.
Building the Team
The core team comprised six graduates of Kathmandu University who were recruited based on their prior contribution to Nepal’s then-nascent OSM community. They were paid full-time salaries at rates commensurate with the local salary structure for recent graduates in technical disciplines. The project also recruited six part-time interns from Kathmandu University and 11 volunteers from Tribhuvan University.
Workspace
The project identified a local co-working space and technology startup incubator that provided access to meeting rooms, reliable Internet service, and opportunities to interact with other technologists and entrepreneurs, some of whom later became active in the local OpenStreetMap community as a result of the team’s outreach efforts.
Existing Map Resources
The mapping team obtained a spreadsheet containing an incomplete list of 1701 schools in the Kathmandu Valley from the Department of Education (DOE), which was then used as a starting point for the survey. The list did not provide the exact location of schools, just the wards in which they were located. For health facilities, Open Cities Kathmandu used three sources to generate a reference list of hospitals, health posts, and polyclinics: a list of 100 private and community hospitals received unofficially from the Ministry of Health and Population (MOHP), a list of 205 medical centers approved by MOHP that is accessible through the official website of the MOHP, and the names of 70 hospitals and 27 polyclinics from a private-sector health organization in Kathmandu. Together, these provided a list of over 400 unique health service providers that the team worked to locate and survey using a similar approach.
Data Collection
The mapping teams used a snowball approach to find locations of the schools. They began with what location data were available through other sources, or by using their personal knowledge and social networks. They then talked with locals, school officials and health facilities personnel to locate remaining schools as well as ascertain the existence of schools not on their list. As a result of requests from school officials, the team also began carrying and distributing pamphlets and posters that provided basic information on earthquake preparedness and safety.
Quality Control
The team took a number of steps to ensure that data collected during the project were accurate and that they would be trusted by the wider group of stakeholders involved in disaster risk reduction in Nepal. First, the project was carried out with explicit support of Nepal’s Department of Education and the World Bank, two institutions with credible reputations in the country. Second, the team consulted frequently on engineering matters with The National Society for Earthquake Technologies (NSET), a well-recognized entity in disaster community in Nepal. NSET Engineers helped design the survey and provided training. The project also provided OSM training to a wide range of individuals from government, donor, and NGO community to build awareness of and comfort with the platform and approach. Finally, NSET conducted quality assessment of OSM data regularly during the surveying process.
Through the involvement of NSET in Open Cities Kathmandu, the team regularly made quality assessments of the survey to both identify problems as they occurred and also to be able to assess the data collected in full at the project’s completion. Of particular concern was the building structure surveying, which required training from NSET for the mapping team and volunteers to survey correctly. The first field verification was performed immediately after the first training and some initial in-field practice. The accuracy of the data for building structural system was 50% during this period. Given this result, NSET provided a “refreshers” training to the surveyors. Following this second training, the accuracy of the structural data increased collected by the mappers rose to 100%.
Results
Open Cities Kathmandu surveyed 2,256 schools and 350 health facilities in the Kathmandu Valley. In addition to collecting a comprehensive list of structural data for health and school facilities, the team worked to create a comprehensive base map of the valley by digitizing building footprints, mapping the road network, and collecting information on other major points of interest. The Open Cities team also conducted significant outreach to universities, technical communities, and government in order to expand the OSM community. Over 2,300 individuals participated in OSM trainings or presentations during the first year of the project. The data have been used in plans to retrofit school and health facilities and in applications for transportation planning; moreover, USAID has incorporated the data into disaster preparedness planning exercises. That the American Red Cross has begun to contribute to OpenStreetMap in Kathmandu suggests that development partners remain interested in the project. A local NGO called the Kathmandu Living Labs (KLL), staffed by participants in the first phase of the Open Cities project, has been created in order to continue the work. KLL has recently received funding from ICIMOD, a local technical organization, and the US Embassy in order to conduct OSM trainings and mapping activities.
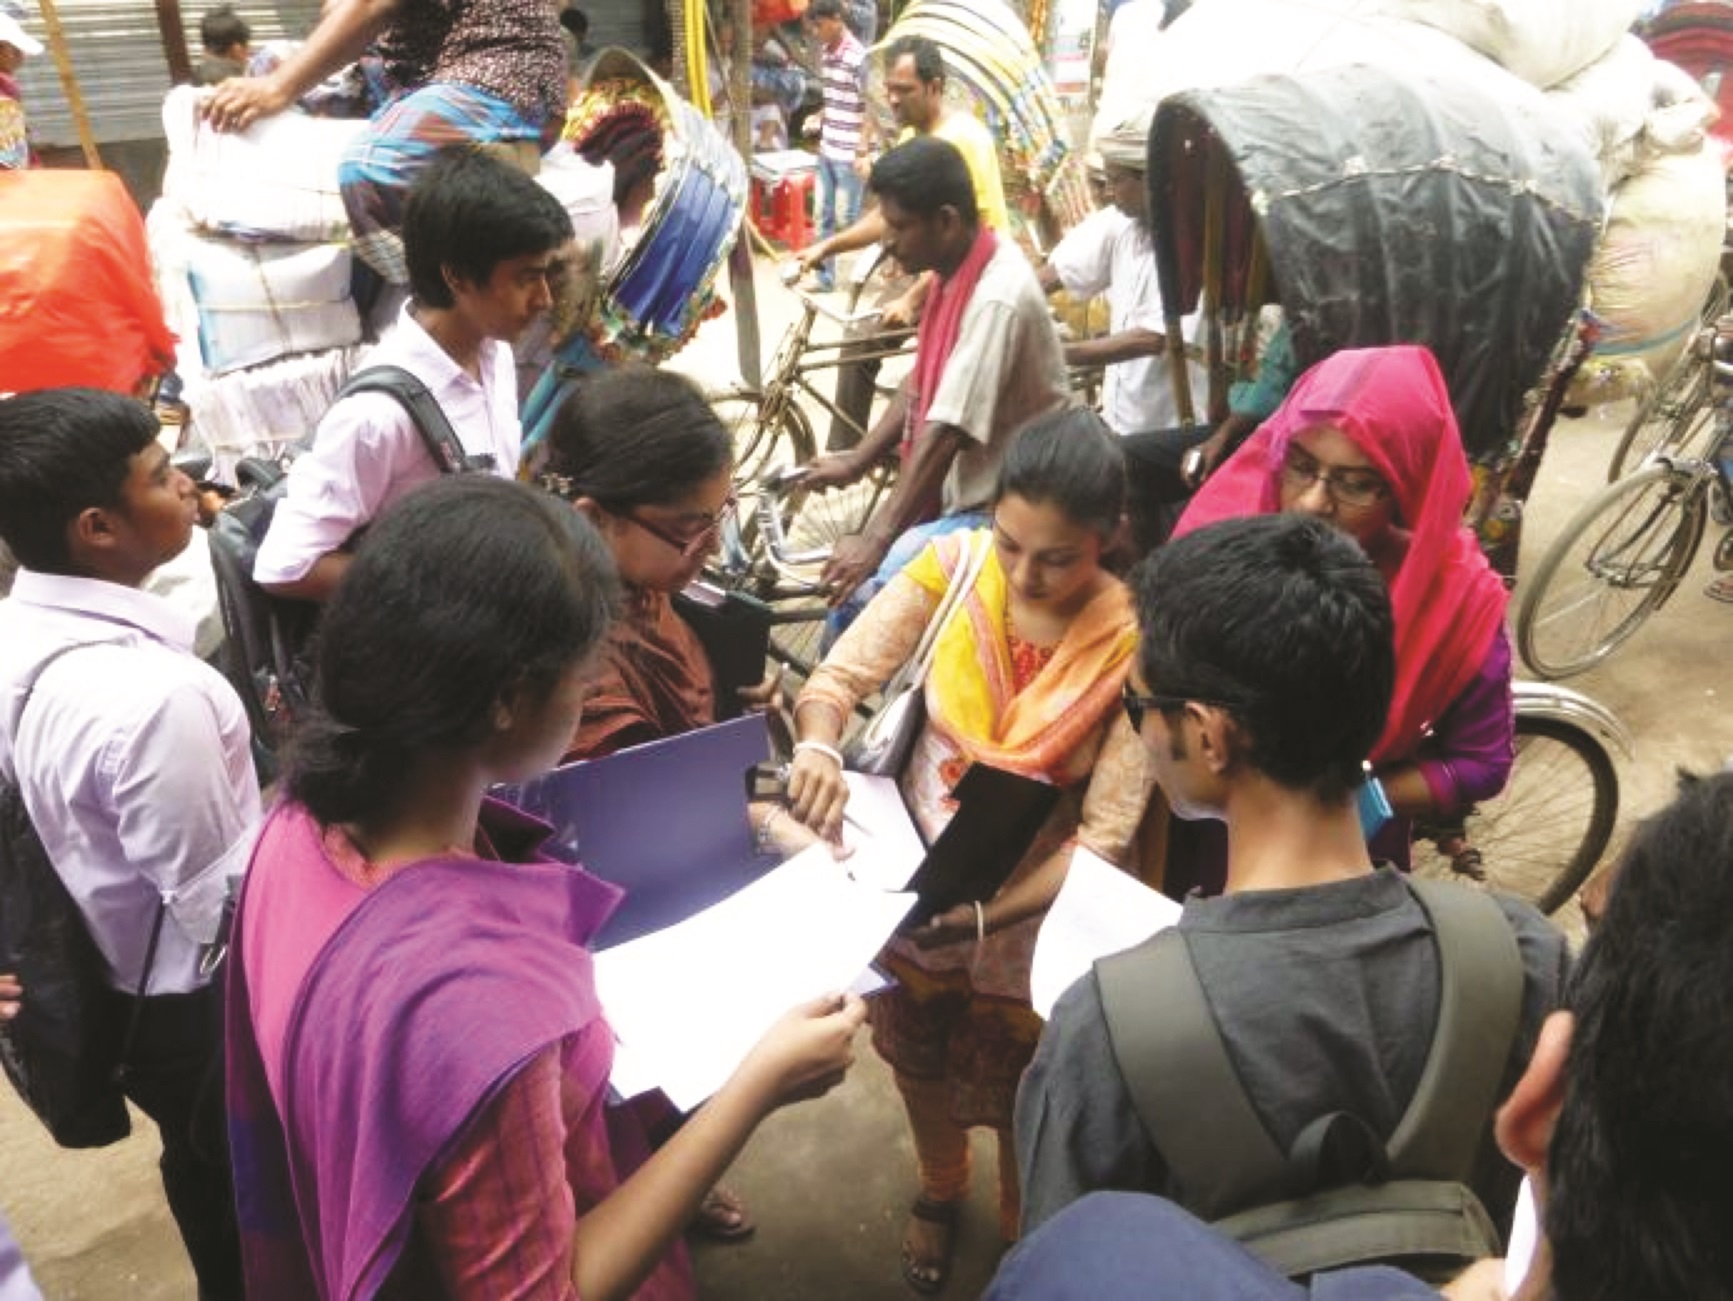
Dhaka, Bangladesh
Overview
Dhaka’s Old City is a crowded and complex area of immense historical value and an important locus of social and economic activity. In consultation with Dhaka Water and Sanitation, seismic risk experts from Bangladesh University of Engineering and Technology (BUET), and the Urban Study Group, a local nongovernmental organization (NGO) working on heritage preservation and restoration in Old Dhaka, the Dhaka Open Cities pilot sought to create detailed maps of three of the Old City’s 15 wards. These maps would provide data useful for planning of evacuation routes, managing water and sanitation infrastructure, and understanding the location and characteristics of heritage buildings.
Partners
Dhaka Water and Sanitation Department — Dhaka WASA was the primary government partner for this project and provided initial data describing water and sanitation infrastructure in Old Dhaka as well as input into the data modelling process.
Urban Study Group — The Urban Study Group provided data on location of critical heritage sites in Old Dhaka as well as input into the data modelling process.
The Center for Environmental and Geographic Information Services (CEGIS) — CEGIS is a local NGO with extensive experience working on GIS and surveying in Bangladesh. They provided overall management of the mapping work and quality assessment of the data collected.
Humanitarian OpenStreetMap Team (HOT) — HOT provided initial OSM training to project participants and assisted with the development of reporting and project tracking processes.
Building the Team
In partnership with BUET, which provided technical support and a working space, 20 engineering and planning undergraduates were hired as mappers and were trained for a three-month period. A local nonprofit GIS consulting organization, CEGIS, was contracted with to provide management and quality control for the work. The Humanitarian OpenStreetMap Team, a nonprofit specializing in the use of OpenStreetMap in development and humanitarian relief situations, also provided training and technical oversight to the project.
Workspace
BUET University provided a computer lab to serve as the primary workspace for training of project participants and data entry work.
Existing Map Resources
The effort began by importing building footprint data for the three wards—created by CEGIS as part of a different project but until that point unavailable to the public—directly into OpenStreetMap. This allowed the mapping team to focus on field surveying, in which basic characteristics, such as building height, usage, construction materials, and age were collected through visual survey of each building.
Data Collection
Mapping teams divided the three wards into so-called blocks - sections which were bounded by roads on all sides. Each day a team would be assigned one or more of these blocks to survey, more easily mapping the densely set buildings due to the small compartmentalized blocks which they were sent to map. Imagery was less useful than normal due to the building density, but this methodology helped ensure accurate data collection.
They also mapped road characteristics (width and surface type) along with important water and sanitation infrastructure. The data were added to OpenStreetMap during times when conditions prohibited field surveys (e.g., poor weather conditions, strikes).
Quality Control
The mappers were divided into small groups of surveying teams, each led by a team leader, who was responsible for organizing and planning their team’s work and ensuring smooth and accurate data entry. The team leaders were also responsible for implementing quality control measures. Twice each month they would randomly select ten percent of their mappers’ buildings and resurvey them. By doing so they could calculate the likely percentage of error of the entire survey, correct a limited number of mistakes, and discover repeated mistakes in the surveyors’ workflow.
Results
During this period, the team was able to finish complete maps of the three wards. In total, 8,500 buildings, 540 of which were deemed to have historical significance, were surveyed. Sections of roads measuring 43km and drainage works measuring over 50km were also assessed. These data are now available to the public through the OpenStreetMap platform. Several training courses and presentations on OpenStreet- Map were also given to university students, government partners, and private sector technology companies during the project period in order to help the OSM community in Dhaka grow. The results of the pilot were presented to the government and other key stakeholders in December 2013. Consultations are ongoing concerning the next phase of the project.
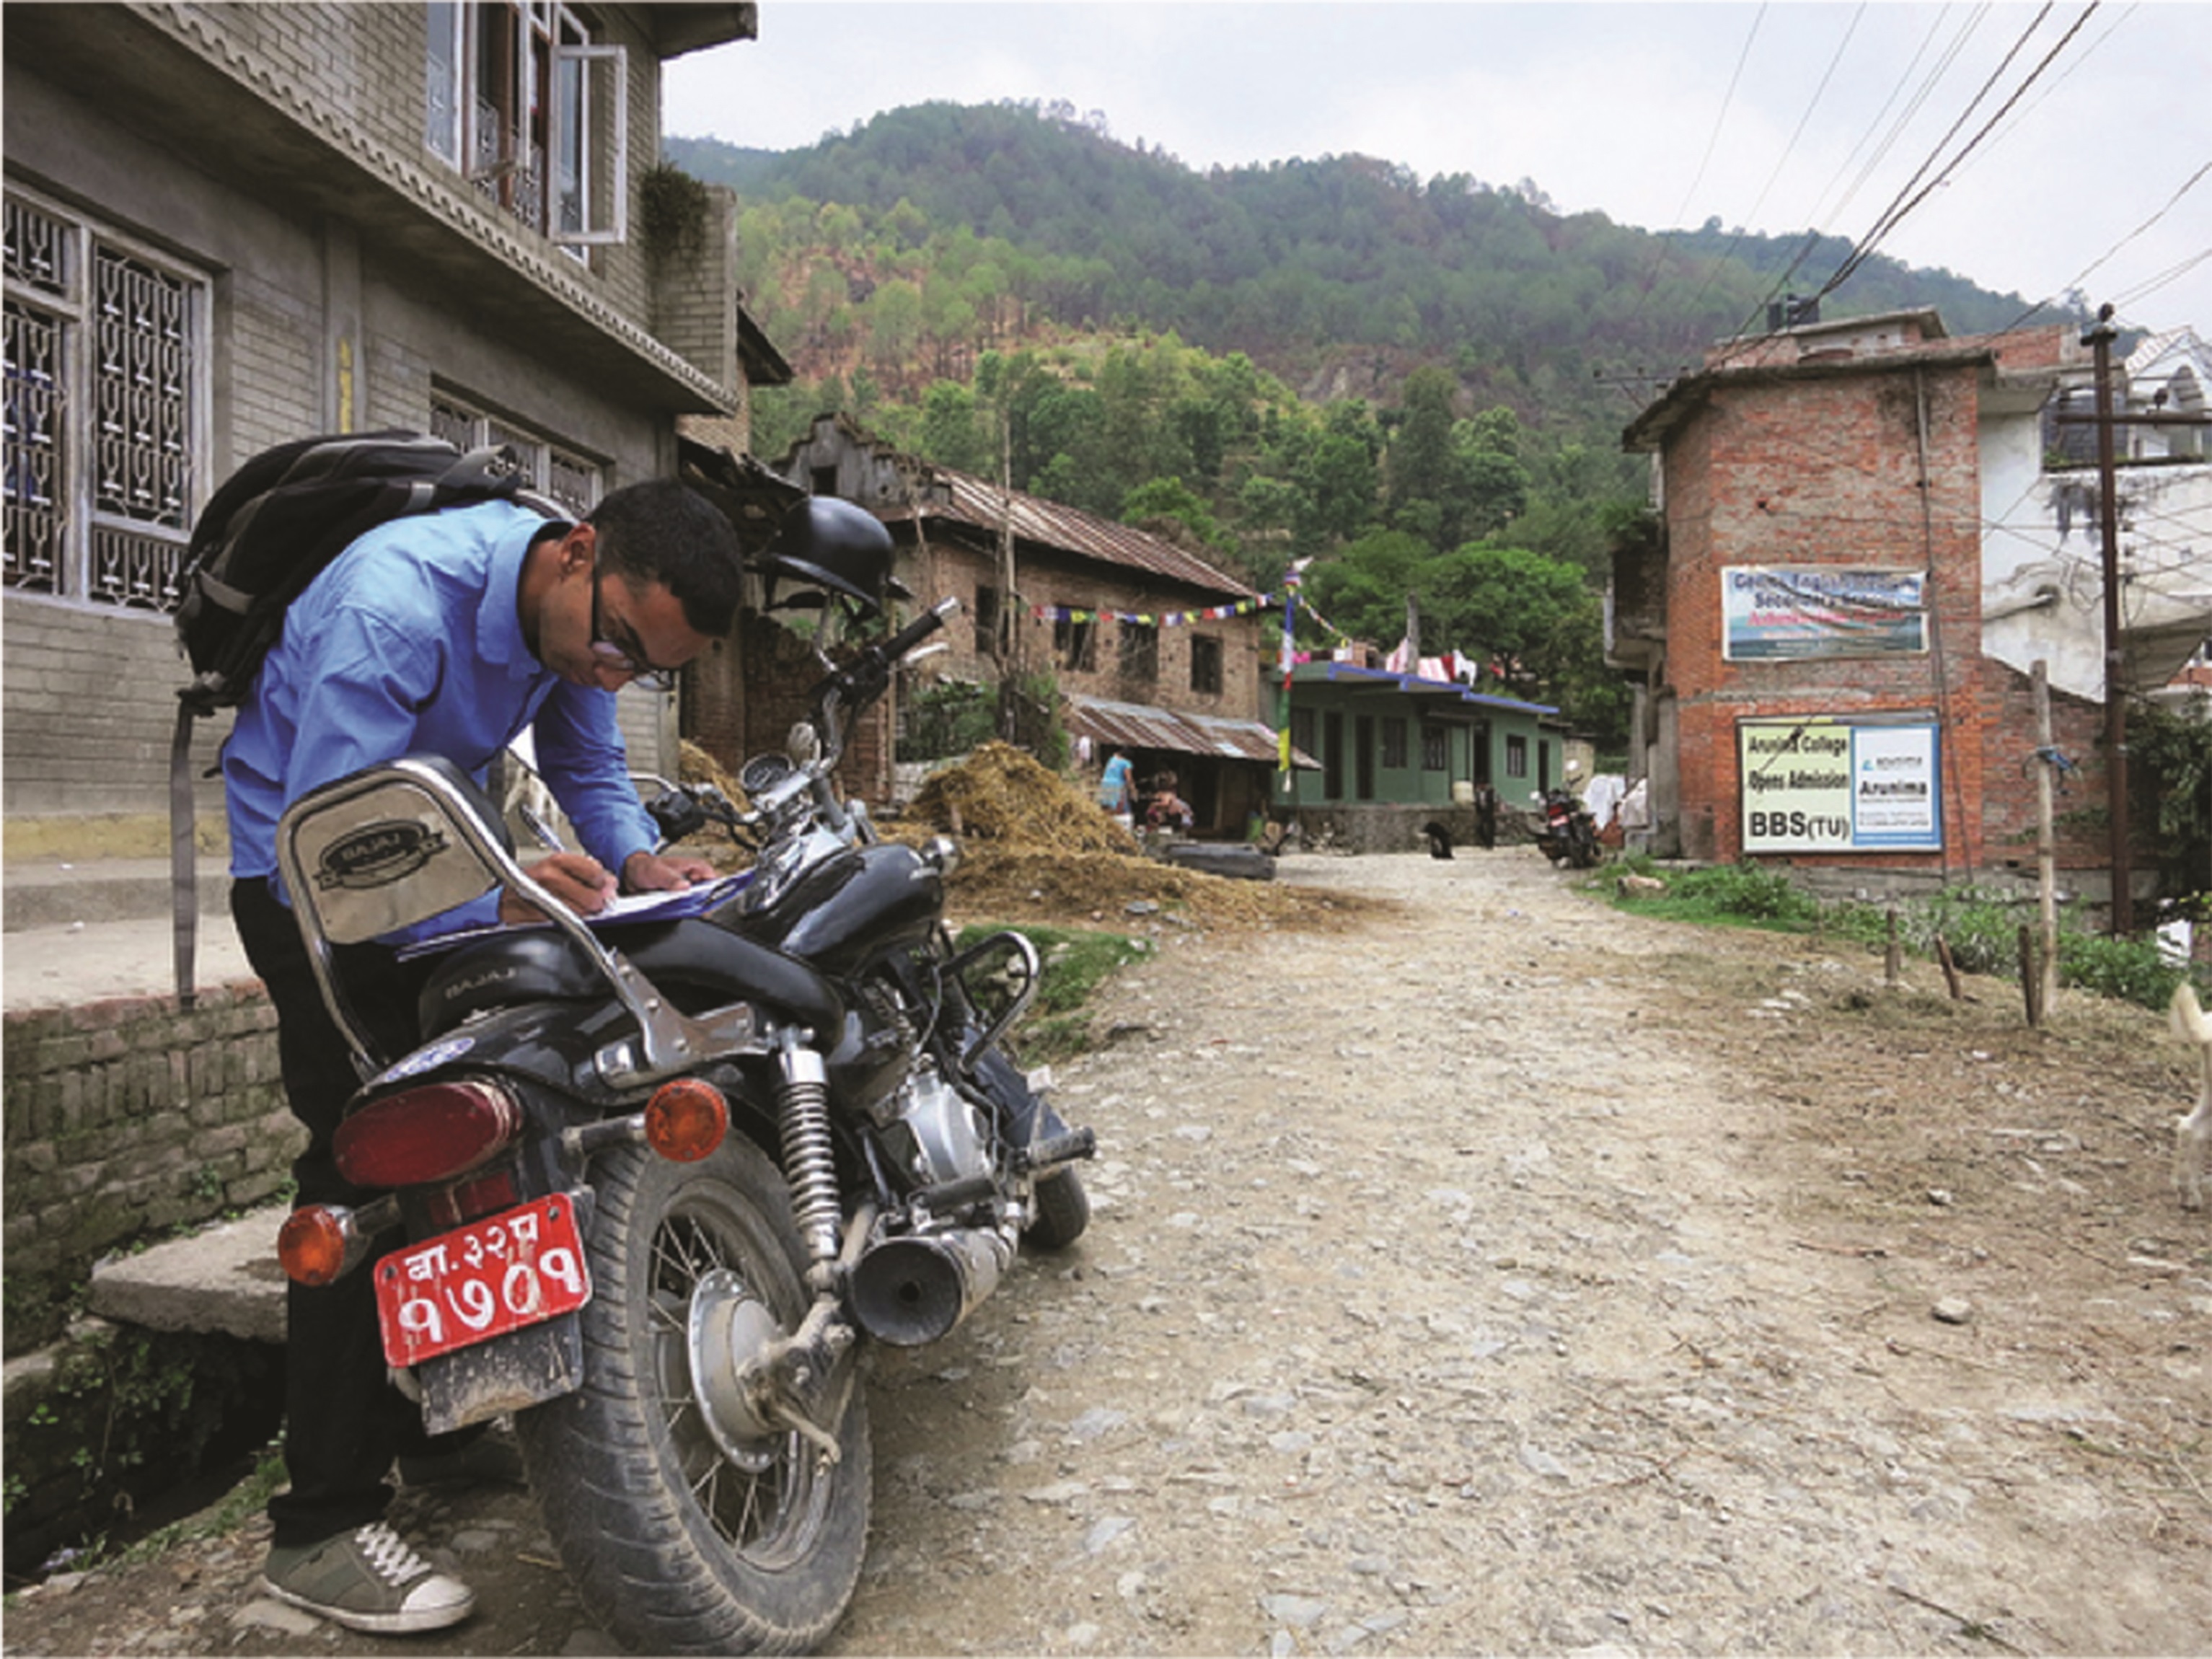
Appendixes
Appendix 1 Data Model Design
Your data model is a chart of the features and attributes of those features that you plan to collect in the field. As described in chapter 3, designing the data model is a process of determining the priorities of your project in coordination with your partners. After a data model has been defined, you must determine how the features will be mapped using the Open- StreetMap tagging system. In OSM, features are drawn as points, lines, or polygons, and tags are applied to these features to describe their attributes. Common tags can be seen on the OSM Wiki site, at wiki.openstreetmap. org/wiki/Map_Features.
OpenStreetMap uses a free-tagging system. That is, you can use any tags that you want to describe attributes. However, it is important that users around the world agree on the same tagging conventions to represent features in order to maintain data uniformity. For example, this is why nearly all tags are in the English language. For most attributes that you want to map, you can probably find an existing tagging convention on the OSM Wiki site. Also useful is taginfo.openstreetmap. org, which provides statistics about tags that are being used in the OSM database. In some cases when you are mapping new features or attributes, it may be necessary to invent new OSM tags. It is a good idea to discuss this with your local e-mail list and by sending a message to tagging@openstreetmap.org.
The data model below (figure A6.1.1), designed for the Open Cities Dhaka pilot project, shows how attributes were mapped as OpenStreetMap tags.
Figure A6.1.1 Sample Data Model, Open Cities Dhaka Project
Open Cities Dhaka OSM TAGGING SYSTEM
1. Streets
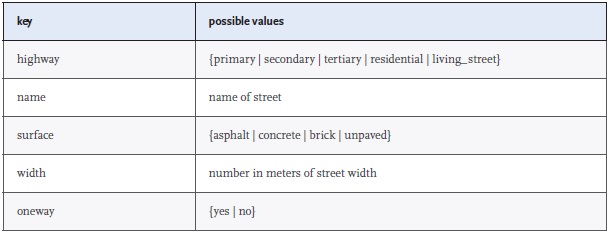
2. Buildings
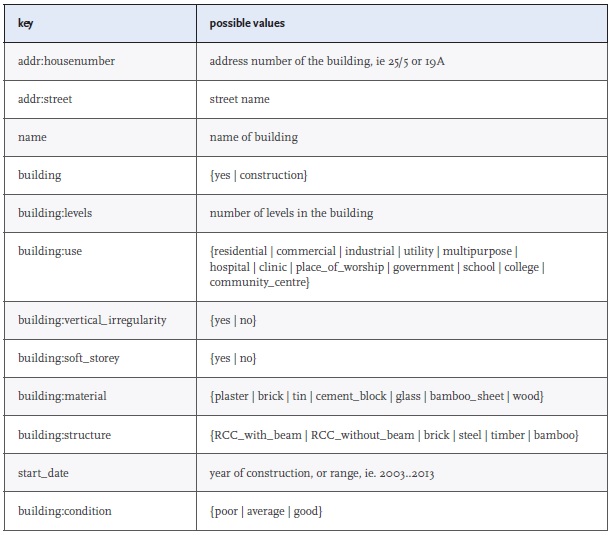
3. Storm Water Drainage
3.1. Drainage lines (ways):
waterway = drain
drain:covered = {yes | no}
3.2. Manhole covers (nodes):
manhole = {drain | sewer}
4. Public Water Source
4.1. Stand Point
amenity=drinking_water
pump:active = {yes | no}
4.2. Hand Pump
man_made = water_well
pump = manual
pump:active = {yes | no}
4.3. Overhead Tank
man_made = water_tower
4.4. Reserve Tank
man_made = water_tank
5. Public Toilets
amenity = toilets
toilets:num_chambers = # of toilets
Source: Open Cities Dhaka. Note: OSM = OpenStreetMap.
Appendix 2 Survey Sample Form
Figure 6.2.1 Building Survey Form, Open Cities Dhaka Project
Open Cities Dhaka – Building Survey Form
Surveyor Name: _________________________________________________________ Date: _____________
Field Paper ID: _________ Ward / Block number: _________ Map Building ID: _________
- General Information:
1.1 Holding #: _________
Building name: _________________________________________________________
Street name: ___________________________________________________________
1.2 Building usage:
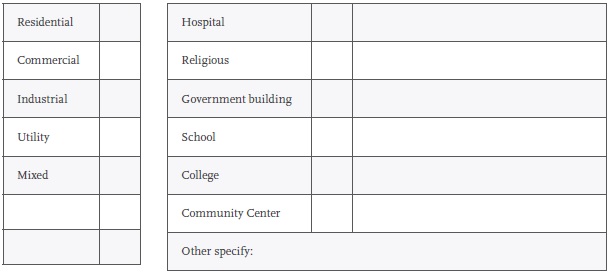
2.1 Number of Stories: 2.2 Vertical Irregularities? Yes / No
2.3 Is there a Soft Storey? Yes / No ( Long / Short direction )
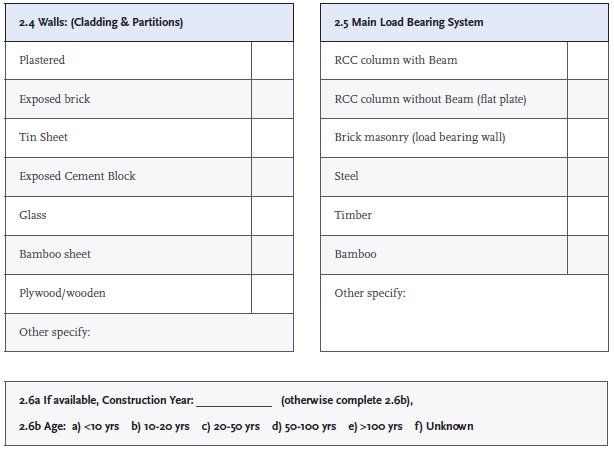
2.7 Visible Physical Condition (Crake, Damp, Spoiling): a) Poor b) Average c) Good
Notes:
Appendix 3 Sample Data Authorization Form
The following letter (Figure 6.3.1) is adapted from the EUROSHA, a European Union pilot project in Burundi, the Central African Republic, Chad, and Kenya. For more examples, visit http://wiki.openstreetmap.org/wiki/Import/GettingPermission.
Figure 6.3.1 Sample Data License Request Letter
We, the undersigned, ………………………………………………………………………… grant to the OpenStreetMap Foundation, in the conditions as stated below, a worldwide, royalty-free, non-exclusive, perpetual, irrevocable licence to do any act that is restricted by copyright, database right or any related right over anything within the Contents, whether in the original medium or any other. These rights explicitly include commercial use, and do not exclude any field of endeavour. These rights include, without limitation, the right to sub-license the work through multiple tiers of sub-licensees and to sue for any copyright violation directly connected with OSMF’s rights under these terms. To the extent allowable under applicable local laws and copyright conventions, we also waive and/or agree not to assert against OSMF or its licensees any moral rights that we may have in the Contents.
We grant to OSMF that it may only use or sub-license our Contents as part of a database and only under the terms of one or more of the following licenses: ODbL 1.0 for the database and DbCL 1.0 for the individual contents of the database; CC-BY-SA 2.0; or such other free and open licence (for example, http://www.opendefinition.org/okd/) as may from time to time be chosen by a vote of the OSMF membership and approved by at least a 2/3 majority vote of active contributors.
We consent OSMF to quote us or cite the owner of the copyright, according to our wishes or these of the copyright holder. The citation will be showed on the following web page http://wiki.openstreetmap.org/ wiki/Attribution.
We offer the OSMF the following data: ………………………………………………………………………………………………………………………… ………………………………………………………………………………………………………………………… ………………………………………………………………………………………………………………………… ………………………………………………………………………………………………………………………… ………………………………………………………
Drawn up at ………………………………, the …………………………… in duplicate.
Signature of the donor: Signature of receiver:
(Preceded by the handwritten words «read and approved»)
Source: EUROSHA Project
Appendix 4 Sample Project Report
It is a good idea to provide snapshot progress reports every two to four weeks during a mapping project. These can be brief, 1- to 2-page documents that highlight any news or changes in project design, mapping progress, and metrics on data collection and quality control. The sample below suggests content to include.
Open Cities Project Update - July 1, 2014
I. Project Updates A brief paragraph summarizing new project developments. For example, any unexpected changes in the project, either positive or negative, may be recorded here. In other words, any project news, such as meetings with key partners, mapping activities, and adjustments to the project design.
- bullet points
- are good
- for document progress
- simply
II. Mapping Progress A simple map produced in GIS software can give a quick visual explanation of your progress.
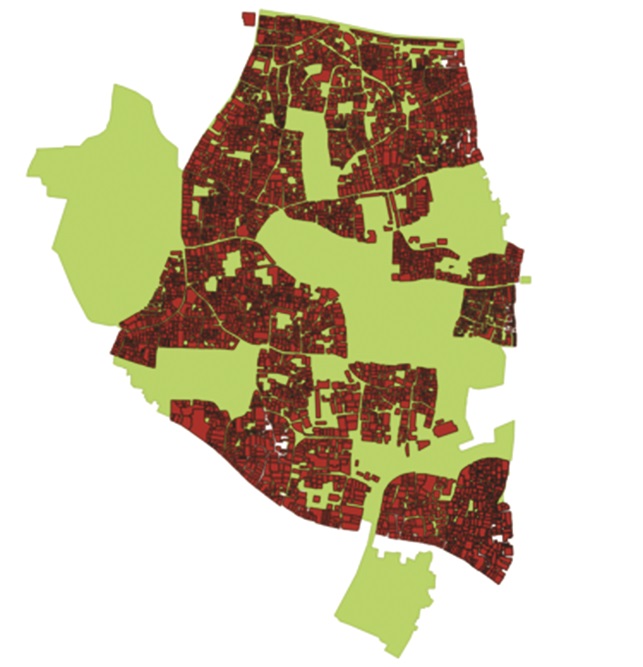
III. Data Collection and Quality Control Metrics
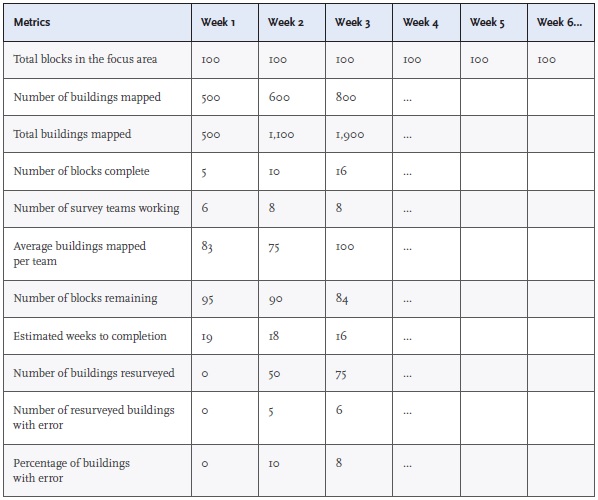
Appendix 5 Sample Letter of Support for Mappers
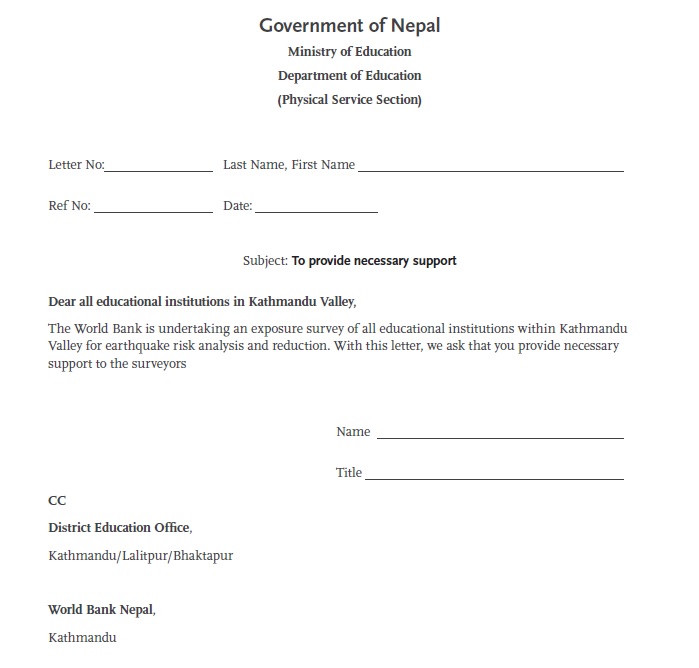
Source: Open Cities Kathmandu
Appendix 6 Open Cities Project Planning Checklist
Here is a complete checklist you may wish to follow when planning a mapping project. It will help you to consider the many factors that go into developing an efficient, effective process.
Partner Outreach
- Identify relevant partners in government, academia, and civil society
- Meet with potential partners, discussing support and areas of collaboration
- Communicate project goals with OpenStreetMap community and meet with local mappers
Defining the Scope of Work
- Obtain a map containing the boundary of the target area
- Estimate the number of features you will map in the area, such as roads, buildings, and so on
- Write out your data model
- Map the data model to OpenStreetMap tags
- Establish a rough time frame for survey completion, noting holiday periods that will halt the work
Building the Team
- Establish management structure
- Determine sources of your staff and how staff will be compensated
- Hire staff
Assessing Resources
- List the existing digital and paper data
- Determine whether you will import any data; if so, create an action plan and time frame
- Draw a map showing parts of your target area where no imagery is available
- Determine whether you will use GPS devices, smartphones, or both; if so, acquire
- Confirm that the necessary base-map data are available to use in Field Papers
Logistics
- Identify where your staff will work
- Ensure reliable Internet connectivity
- List the equipment you need and acquire it
Training
- Identify who will conduct the training and what material will be covered
- Collect necessary training materials, develop training manual
- Identify a location to host the training (maybe the same as the project office)
- Create a training schedule
Collecting the Data
- Create and print reference maps
- Divide target area into daily mapping blocks; enumerate and make a statistics spreadsheet, providing each block its own row
- Create and print survey forms
- Create and print survey training manual
- Make daily work schedule
- Create detailed project implementation schedule Quality Control
- Determine methods to monitor data quality, and include these in your project schedule and daily schedule
Reporting
- Determine the metrics to include in your project reports
- Add tasks into your schedule to ensure that metrics are collected and documented regularly
- Maintain statistics each day in a spreadsheet